AB InBev Reports First Quarter 2023 Results
Consistent execution of our strategy drives double-digit top and bottom-line growth
BRUSSELSBRUSSELS -- (BUSINESS WIRE) --
AB InBev (Brussel:ABI) (BMV:ANB) (JSE:ANH) (NYSE:BUD):
This press release features multimedia. View the full release here: https://www.businesswire.com/news/home/20230504005165/en/
Regulated and inside information1
“Our business momentum continued this quarter, delivering a 13.2% increase in revenue through a combination of both volume and revenue per hl growth, and an EBITDA increase of 13.6%. We continue to invest for the long-term and these results reinforce our confidence in the resilience of the beer category, the effectiveness of our strategy and the strength of our platform to deliver consistent profitable growth.” – Michel Doukeris, CEO, AB InBev
Total Revenue
+ 13.2%
Revenue increased by 13.2% with revenue per hl growth of 12.4%.
15.4% increase in combined revenues of our global brands, Budweiser, Stella Artois and Corona, outside of their respective home markets.
Approximately 62% of our revenue through B2B digital platforms with the monthly active user base of BEES reaching 3.1 million users.
Over 100 million USD of revenue generated by our digital direct-to-consumer ecosystem.
Total Volume
+0.9%
Total volumes grew by 0.9%, with own beer volumes up by 0.4% and non-beer volumes up by 3.6%. Normalized EBITDA
+ 13.6%
Normalized EBITDA increased by 13.6% to 4 759 million USD with a normalized EBITDA margin expansion of 13 bps to 33.5%.
Underlying Profit
1 310 million USD
Underlying profit (normalized profit attributable to equity holders of AB InBev excluding the impact of hyperinflation) was 1 310 million USD in 1Q23 compared to 1 204 million USD in 1Q22.
Underlying EPS
0.65 USD
Underlying EPS was 0.65 USD in 1Q23, an increase from 0.60 USD in 1Q22.
1The enclosed information constitutes inside information as defined in Regulation (EU) No 596/2014 of the European Parliament and of the Council of 16 April 2014 on market abuse, and regulated information as defined in the Belgian Royal Decree of 14 November 2007 regarding the duties of issuers of financial instruments which have been admitted for trading on a regulated market. For important disclaimers and notes on the basis of preparation, please refer to page 13.
Management comments
Consistent execution of our strategy drives double-digit top and bottom-line growth
We delivered top-line growth of 13.2%, comprised of a mix of 0.9% volume and 12.4% revenue per hl growth, driven by pricing actions, ongoing premiumization and other revenue management initiatives. EBITDA increased by 13.6% with margin expansion of 13bps, despite anticipated commodity cost headwinds and while increasing sales and marketing investments in our brands. Underlying USD earnings per share increased by 8.7%.
Progressing our strategic priorities
We continue to execute on and invest in three key strategic pillars to deliver consistent growth and long-term value creation.
Lead and grow the category:
This quarter we delivered a broad-based total volume increase of 0.9% with volume growth and revenue growth in more than 60% and 80% of our markets, respectively.
Digitize and monetize our ecosystem:
BEES captured approximately $8.2 billion USD of gross merchandise value (GMV), a 32% increase versus 1Q22 with 62% of our revenue through B2B digital channels. BEES Marketplace is live in 15 markets and generated an annualized GMV of approximately 1.2 billion USD with 59% of BEES customers now also Marketplace buyers.
Optimize our business:
EBITDA grew by 13.6% with margin expansion of 13bps, supported by disciplined resource allocation and overhead management.
Lead and grow the category
We are executing on five proven and scalable levers to drive category expansion:
· Inclusive Category: Through our focus on brand, pack and liquid innovations, we continued to increase the average percentage of consumers purchasing our portfolio of brands, according to our estimates. This increase in participation was led by consumers in our emerging markets.
· Core Superiority: Our mainstream portfolio delivered low-teens revenue growth and gained market share in 75% of our key markets, according to our estimates.
· Occasions Development: Our global no-alcohol beer portfolio delivered over 30% revenue growth, with our performance driven by Budweiser Zero in Brazil and the US, where the brand was the #1 no-alcohol beer by volume in 1Q23, and growth of Corona Cero across Canada and Europe. In addition, our digital direct-to-consumer products are enabling a deeper understanding of our consumers, resulting in the development of new consumption occasions such as Brahma Soccer Wednesday’s and Corona Sunsets.
· Premiumization: Our above core beer portfolio grew revenue by mid-teens, led by continued double-digit growth of Michelob ULTRA in the US and Mexico and double-digit growth of Original and Spaten in Brazil. Our global brands grew revenue by 15.4% outside of their home markets, led by Budweiser with 17.8% growth, supported by the return of consumer demand in China and continued growth in India. Stella Artois grew by 13.3% and Corona by 11.9%.
· Beyond Beer: Our global Beyond Beer business contributed over 325 million USD of revenue and grew by low-single digits as growth globally was partially offset by a soft malt-based seltzer industry in the US. In Brazil, Beats successfully activated demand during the return of Carnival and delivered over 75% revenue growth. In the US, within the spirits-based ready-to-drink segment, Cutwater and NÜTRL vodka seltzer combined grew revenues by over 50%.
Digitize and monetize our ecosystem
· Digitizing our relationships with more than 6 million customers globally: As of 31 March 2023, BEES is live in 20 markets with approximately 62% of our 1Q23 revenues captured through B2B digital platforms. In 1Q23, BEES had 3.1 million monthly active users and captured approximately 8.2 billion USD in gross merchandise value (GMV), growth of 16% and 32% versus 1Q22 respectively. BEES Marketplace is live in 15 markets with 59% of BEES customers also marketplace buyers. Marketplace captured approximately 295 million USD in GMV from sales of third-party products, growth of 34% versus 1Q22.
· Leading the way in DTC solutions: Our omnichannel direct-to-consumer (DTC) ecosystem of digital and physical products generated revenue of more than 330 million USD, high-single digit growth versus 1Q22. Our digital DTC products, Zé Delivery, TaDa and PerfectDraft are now available in 20 markets, and generated over 100 million USD in revenue, representing low-teens growth versus 1Q22.
Optimize our business
EBITDA grew by 13.6% with margin expansion of 13bps, supported by disciplined resource allocation and overhead management. Our bond portfolio maintains a very manageable weighted average pre-tax coupon rate of approximately 4% with 95% of the portfolio fixed rate. In recognition of our deleveraging progress and strong free cash flow generation our credit rating was recently upgraded from Baa1 to A3 by Moody’s and from BBB+ to A- by S&P.
Advancing our sustainability priorities
We continue to deliver on our sustainability agenda to enable our commercial vision and fulfill our company purpose. Collaboration is key to achieving a more sustainable future and, this quarter, we were named a top 2022 Supplier Engagement Leader by CDP in recognition of the action we are taking to drive decarbonization across our supply chain.
Creating a future with more cheers
Through the consistent implementation of our category expansion levers, we continue to lead and grow the beer category, delivering broad-based volume and revenue growth across our markets. Digitizing and monetizing our ecosystem is bringing us closer than ever to our customers and consumers and we continue to optimize our business with a relentless focus on disciplined resource allocation and everyday efficiency.
We are investing for the long-term and continue to build on our platform to deliver consistent profitable growth. Our industry leading portfolio of brands across all price points, advantaged geographic footprint and accelerated digital transformation position us well to generate value for our stakeholders and deliver on our purpose to create a future with more cheers.
2023 Outlook
(i) Overall Performance: We expect our EBITDA to grow in line with our medium-term outlook of between 4-8% and our revenue to grow ahead of EBITDA from a healthy combination of volume and price. The outlook for FY23 reflects our current assessment of inflation and other macroeconomic conditions.
(ii) Net Finance Costs: Net pension interest expenses and accretion expenses are expected to be in the range of 200 to 230 million USD per quarter, depending on currency and interest rate fluctuations. We expect the average gross debt coupon in FY23 to be approximately 4%.
(iii) Effective Tax Rates (ETR): We expect the normalized ETR in FY23 to be in the range of 27% to 29%. The ETR outlook does not consider the impact of potential future changes in legislation.
(iv) Net Capital Expenditure: We expect net capital expenditure of between 4.5 and 5.0 billion USD in FY23.
Figure 1. Consolidated performance (million USD)
1Q221Q23Organic
growth
Total Volumes (thousand hls)139 344140 5480.9%
AB InBev own beer120 585121 0600.4%
Non-beer volumes17 94518 5873.6%
Third party products81590112.0%
Revenue13 23514 21313.2%
Gross profit7 2467 69612.4%
Gross margin54.8%54.1%-35 bps
Normalized EBITDA4 4864 75913.6%
Normalized EBITDA margin33.9%33.5%13 bps
Normalized EBIT3 2943 50314.9%
Normalized EBIT margin24.9%24.6%39 bps
Profit attributable to equity holders of AB InBev951 639
Underlying profit attributable to equity holders of AB InBev1 2041 310
Earnings per share (USD)0.050.81
Underlying earnings per share (USD)0.600.65
Figure 2. Volumes (thousand hls)
1Q22ScopeOrganic1Q23Organic growth
growthTotal VolumeOwn beer volume
North America24 08716-25023 853-1.0%-1.1%
Middle Americas34 249-2334 2710.1%-0.5%
South America40 394-7- 10140 286-0.2%-1.8%
EMEA20 12443-21019 958-1.0%-1.5%
Asia Pacific20 288-1 82622 1149.0%8.8%
Global Export and Holding Companies202-52-8466-55.7%-56.5%
AB InBev Worldwide139 344-1 204140 5480.9%0.4%
Key Market Performances
United States: Continued top-line growth with stable EBITDA despite the elevated cost environment
· Operating performance: Revenue grew by 4.0% with revenue per hl increasing by 5.6%, driven by revenue management initiatives and continued premiumization. Sales-to-wholesalers (STWs) were down by 1.6% and sales-to-retailers (STRs) declined by 3.0%, estimated to be below the industry. EBITDA was flat.
· Commercial highlights: The beer industry performance improved in 1Q23, demonstrating resilience even in the context of an ongoing inflationary environment. We continue to execute our commercial strategy, with our above core beer and Beyond Beer brands collectively increasing their share of our revenue. Our above core beer portfolio continued to gain share of the segment, growing volumes by low-single digits. In Beyond Beer, our spirits-based ready-to-drink portfolio grew volume by strong double-digits.
Mexico: Double-digit top- and bottom-line growth
· Operating performance: Revenue grew by mid-teens, with low-teens revenue per hl growth driven by pricing actions and other revenue management initiatives. Our volumes grew by low-single digits, outperforming the industry, supported by the phasing impact of an earlier Easter. EBITDA grew by low-teens.
· Commercial highlights: We delivered broad-based volume growth across price segments, driven by ongoing portfolio development and digital transformation. Our above core brands once again led our growth, increasing volumes by low-teens, driven by Michelob ULTRA and Modelo. We continued to progress our digital and physical DTC initiatives with our digital DTC platform, TaDa, now operating in over 50 cities and fulfilling on average over 300 000 orders per month, and further expansion of our Modelorama footprint to over 10 000 stores.
Colombia: Continued top-line growth and share of alcohol gains despite inflationary pressures impacting consumer demand
· Operating performance: Revenue increased by mid-single digits with high-single digit revenue per hl growth, driven by pricing actions and other revenue management initiatives. Volumes declined by low-single digits, as overall consumer demand was impacted by inflationary pressures. EBITDA declined by low-single digits due primarily to anticipated commodity cost headwinds and elevated distribution costs.
· Commercial highlights: We continue to invest behind our category expansion levers to lead and grow the category, with our beer portfolio continuing to gain share of total alcohol. Our leading mainstream portfolio drove our performance, delivering mid-single digit revenue growth with a particularly strong performance from Poker which grew volumes by high-single digits.
Brazil: Double-digit top- and bottom-line growth with margin expansion
· Operating performance: Revenue grew by 15.7% with revenue per hl growth of 12.9%, driven by revenue management initiatives and continued premiumization. Volumes grew by 2.5%, with beer volumes increasing by 0.9%, representing stable market share, and non-beer volumes by 7.3%. EBITDA increased by 26.5% with margin expansion of 235bps.
· Commercial highlights: Our premium and super premium portfolios continued to outperform, delivering volume growth in the mid-thirties, led by Original and Spaten. Non-beer volume growth was led by the performance of Guaraná Antarctica Zero and Pepsi Black and supported by the expansion of portfolio availability through BEES. BEES Marketplace continued to expand partnerships and product availability, reaching over 700 thousand customers, a 70% increase versus 1Q22. Our digital DTC platform, Zé Delivery, has now reached 5 million monthly active users, a 9% increase versus 1Q22.
Europe: Double-digit top-line and high-single digit bottom-line growth
· Operating performance: Revenue grew by low-teens, with flattish volume and low-teens revenue per hl growth driven by pricing actions, ongoing demand for our premium brands and on-premise recovery. EBITDA grew by high-single digits.
· Commercial highlights: We continued to premiumize our portfolio in Europe. Our global brands and super premium portfolio delivered low-teens revenue growth, led by Budweiser and Corona.
South Africa: High-single digit top-line growth with record high quarterly volumes
· Operating performance: Revenue grew by high-single digits with high-single digit revenue per hl growth and low-single digit volume growth, ahead of the industry according to our estimates. EBITDA declined by low-single digits due primarily to anticipated commodity cost headwinds.
· Commercial highlights: The momentum of our business continued, delivering record high volumes for the first quarter. Our performance was led by Carling Black Label, the #1 beer brand in the country, which delivered over 20% revenue growth. Our premium, super premium and beyond beer portfolios all delivered double-digit increases in revenue.
China: Double-digit top- and bottom-line growth as consumer demand accelerates
· Operating performance: Volumes grew by 7.4%, outperforming the industry according to our estimates, as the operating environment in our key regions and sales channels improved throughout the quarter. Revenue per hl increased by 3.3%, driven by premiumization and revenue management initiatives, resulting in revenue growth of 11.0%. EBITDA grew by 13.2%.
· Commercial highlights: We delivered volume growth across all segments of our portfolio driven by continued investment behind our commercial strategy. Our performance was led by our premium and super premium brands which grew volumes by approximately 10%. The roll out and adoption of the BEES platform has accelerated, with BEES now present in over 180 cities and representing approximately 40% of our revenue in March.
Highlights from our other markets
· Canada: Revenue increased by mid-teens with revenue per hl growth of high-single digits, driven by revenue management initiatives and premiumization. Volume increased by mid-single digits, outperforming the industry and supported by a favorable comparable from COVID-19 restrictions implemented in 1Q22.
· Peru: We delivered double-digit top-line growth with revenue per hl growing by low-teens, driven primarily by pricing actions and other revenue management initiatives. Volumes increased by low-single digits.
· Ecuador: Revenue grew by high-single digits with volumes increasing by low-single digits, supported by a favorable comparable from COVID-19 restrictions implemented in January last year. We continue to focus on expanding the beer category and driving premiumization with our above core brands growing revenue by double-digits.
· Argentina: Revenue increased by high-single digits on a reported USD basis and by over 100% on an organic basis, driven by revenue management initiatives in a highly inflationary environment. Volumes declined by high-single digits due primarily to inflationary pressures impacting consumer purchasing power.
· Africa excluding South Africa: In Nigeria, our top-line declined by mid-single digits with beer volumes declining by approximately 20%, in-line with the industry according to our estimates. Industry performance was impacted by a temporary lack of local currency limiting the ability of consumers to purchase goods. In our other markets, we grew revenue in aggregate by high-single digits, driven by Tanzania, Uganda and Ghana.
· South Korea: Volumes grew by double-digits driven by the strong performance of our local champion Cass, continued market share expansion and further improvement in the operating environment. Revenue per hl increased by low-single digits resulting in low-teens revenue growth.
Consolidated Income Statement
Figure 3. Consolidated income statement (million USD)
1Q221Q23Organic
growth
Revenue13 23514 21313.2%
Cost of sales-5 989-6 517-14.0%
Gross profit7 2467 69612.4%
SG&A-4 116-4 344-10.3%
Other operating income/(expenses)1641527.4%
Normalized profit from operations (normalized EBIT)3 2943 50314.9%
Non-underlying items above EBIT (incl. impairment losses)-96-46
Net finance income/(cost)-1 192-1 237
Non-underlying net finance income/(cost)104375
Share of results of associates5550
Non-underlying share of results of associates-1 143-
Income tax expense-524-597
Profit4992 048
Profit attributable to non-controlling interest404409
Profit attributable to equity holders of AB InBev951 639
Normalized EBITDA4 4864 75913.6%
Underlying profit attributable to equity holders of AB InBev1 2041 310
We are reporting our Argentinean operation applying hyperinflation accounting under IAS 29, following the categorization of Argentina as a country with a three-year cumulative inflation rate greater than 100%, since 2018. Inflation in Argentina has accelerated over the past 12 months, resulting in a more significant impact on the organic revenue growth of AB InBev than historically. For illustrative purposes, fully excluding the Argentinean operation, 1Q23 organic revenue growth for AB InBev would be 9.1% versus the 13.2% reported.
Consolidated other operating income/(expenses) in 1Q23 increased by 7.4% primarily driven by higher government grants. In 1Q22, Ambev recognized 17 million USD income in other operating income related to tax credits. The impact is presented as a scope change and does not affect the presented organic growth rates.
Non-underlying items above EBIT & Non-underlying share of results of associates
Figure 4. Non-underlying items above EBIT & Non-underlying share of results of associates (million USD)
1Q221Q23
COVID-19 costs-9-
Restructuring-37-27
Business and asset disposal (incl. impairment losses)-4-19
AB InBev Efes related costs-46-
Non-underlying items in EBIT-96-46
Non-underlying share of results of associates-1 143-
EBIT excludes negative non-underlying items of 46 million USD in 1Q23.
Non-underlying share of results of associates in 1Q22 includes the non-cash impairment of 1 143 million USD the company recorded on its investment in AB InBev Efes.
Net finance income/(cost)
Figure 5. Net finance income/(cost) (million USD)
1Q221Q23
Net interest expense-846-806
Net interest on net defined benefit liabilities-18-21
Accretion expense-150-183
Net interest income on Brazilian tax credits4831
Other financial results-225-257
Net finance income/(cost)-1 192-1 237
Non-underlying net finance income/(cost)
Figure 6. Non-underlying net finance income/(cost) (million USD)
1Q221Q23
Mark-to-market231375
Gain/(loss) on bond redemption and other-127-
Non-underlying net finance income/(cost)104375
Non-underlying net finance cost in 1Q23 includes mark-to-market gains on derivative instruments entered into to hedge our shared-based payment program and shares issued in relation to the combination with Grupo Modelo and SAB.
The number of shares covered by the hedging of our share-based payment program, the deferred share instrument and the restricted shares are shown in figure 7, together with the opening and closing share prices.
Figure 7. Non-underlying equity derivative instruments
1Q221Q23
Share price at the start of the period (Euro)53.1756.27
Share price at the end of the period (Euro)54.2661.33
Number of equity derivative instruments at the end of the period (millions)100.5100.5
Income tax expense
Figure 8. Income tax expense (million USD)
1Q221Q23
Income tax expense524597
Effective tax rate24.8%23.0%
Normalized effective tax rate25.6%26.8%
The increase in normalized ETR in 1Q23 compared to 1Q22 is driven by country mix.
Figure 9. Underlying Profit attributable to equity holders of AB InBev (million USD)
1Q221Q23
Profit attributable to equity holders of AB InBev951 639
Net impact of non-underlying items on profit1 119-342
Hyperinflation impacts in underlying profit- 1113
Underlying profit attributable to equity holders of AB InBev1 2041 310
Basic and underlying EPS
Figure 10. Earnings per share (USD)
1Q221Q23
Basic EPS0.050.81
Net impact of non-underlying items on profit0.56-0.18
Hyperinflation impacts in EPS-0.010.01
Underlying EPS0.600.65
Weighted average number of ordinary and restricted shares (million)2 0122 015
Figure 11. Key components - Underlying EPS in USD
1Q221Q23
Normalized EBIT before hyperinflation1.651.76
Hyperinflation impacts in normalized EBIT-0.01-0.02
Normalized EBIT1.651.74
Net finance cost-0.59-0.61
Income tax expense-0.27-0.30
Associates & non-controlling interest-0.17-0.18
Hyperinflation impacts in EPS-0.010.01
Underlying EPS0.600.65
Weighted average number of ordinary and restricted shares (million)2 0122 015
Reconciliation between normalized EBITDA and profit attributable to equity holders
Figure 12. Reconciliation of normalized EBITDA to profit attributable to equity holders of AB InBev (million USD)
1Q221Q23
Profit attributable to equity holders of AB InBev951 639
Non-controlling interests404409
Profit4992 048
Income tax expense524597
Share of result of associates-55-50
Non-underlying share of results of associates1 143-
Net finance (income)/cost1 1921 237
Non-underlying net finance (income)/cost-104-375
Non-underlying items above EBIT (incl. impairment losses)9646
Normalized EBIT3 2943 503
Depreciation, amortization and impairment1 1921 255
Normalized EBITDA4 4864 759
Normalized EBITDA and normalized EBIT are measures utilized by AB InBev to demonstrate the company’s underlying performance.
Normalized EBITDA is calculated excluding the following effects from profit attributable to equity holders of AB InBev: (i) non-controlling interest; (ii) income tax expense; (iii) share of results of associates; (iv) non-underlying share of results of associates; (v) net finance income or cost; (vi) non-underlying net finance income or cost; (vii) non-underlying items above EBIT; and (viii) depreciation, amortization and impairment.
Normalized EBITDA and normalized EBIT are not accounting measures under IFRS accounting and should not be considered as an alternative to profit attributable to equity holders as a measure of operational performance, or an alternative to cash flow as a measure of liquidity. Normalized EBITDA and normalized EBIT do not have a standard calculation method and AB InBev’s definition of normalized EBITDA and normalized EBIT may not be comparable to that of other companies.
Notes
To facilitate the understanding of AB InBev’s underlying performance, the analyses of growth, including all comments in this press release, unless otherwise indicated, are based on organic growth and normalized numbers. In other words, financials are analyzed eliminating the impact of changes in currencies on translation of foreign operations, and scope changes. Scope changes represent the impact of acquisitions and divestitures, the start or termination of activities or the transfer of activities between segments, curtailment gains and losses and year over year changes in accounting estimates and other assumptions that management does not consider as part of the underlying performance of the business. The organic growth of our global brands, Budweiser, Stella Artois and Corona, excludes exports to Australia for which a perpetual license was granted to a third party upon disposal of the Australia operations in 2020. All references per hectoliter (per hl) exclude US non-beer activities. Whenever presented in this document, all performance measures (EBITDA, EBIT, profit, tax rate, EPS) are presented on a “normalized” basis, which means they are presented before non-underlying items. Non-underlying items are either income or expenses which do not occur regularly as part of the normal activities of the Company. They are presented separately because they are important for the understanding of the underlying sustainable performance of the Company due to their size or nature. Normalized measures are additional measures used by management and should not replace the measures determined in accordance with IFRS as an indicator of the Company’s performance. As from 1 January 2023, mark-to-market gains/(losses) on derivatives related to the hedging of our share-based payment programs are reported in the non-underlying net finance income/(cost). The 2022 presentation was amended to conform to the 2023 presentation. We are reporting the results from Argentina applying hyperinflation accounting since 3Q18. The IFRS rules (IAS 29) require us to restate the year-to-date results for the change in the general purchasing power of the local currency, using official indices before converting the local amounts at the closing rate of the period. These impacts are excluded from organic calculations. In 1Q23, we reported a negative impact on the profit attributable to equity holders of AB InBev of 13 million USD. The impact in 1Q23 basic EPS was -0.01 USD. Values in the figures and annexes may not add up, due to rounding. 1Q23 EPS is based upon a weighted average of 2 015 million shares compared to a weighted average of 2 012 million shares for 1Q22.
Legal disclaimer
This release contains “forward-looking statements”. These statements are based on the current expectations and views of future events and developments of the management of AB InBev and are naturally subject to uncertainty and changes in circumstances. The forward-looking statements contained in this release include statements other than historical facts and include statements typically containing words such as “will”, “may”, “should”, “believe”, “intends”, “expects”, “anticipates”, “targets”, “estimates”, “likely”, “foresees” and words of similar import. All statements other than statements of historical facts are forward-looking statements. You should not place undue reliance on these forward-looking statements, which reflect the current views of the management of AB InBev, are subject to numerous risks and uncertainties about AB InBev and are dependent on many factors, some of which are outside of AB InBev’s control. There are important factors, risks and uncertainties that could cause actual outcomes and results to be materially different, including, but not limited to the risks and uncertainties relating to AB InBev that are described under Item 3.D of AB InBev’s Annual Report on Form 20-F filed with the SEC on 17 March 2023. Many of these risks and uncertainties are, and will be, exacerbated by any further worsening of the global business and economic environment, the ongoing conflict in Russia and Ukraine and the COVID-19 pandemic. Other unknown or unpredictable factors could cause actual results to differ materially from those in the forward-looking statements. The forward-looking statements should be read in conjunction with the other cautionary statements that are included elsewhere, including AB InBev’s most recent Form 20-F and other reports furnished on Form 6-K, and any other documents that AB InBev has made public. Any forward-looking statements made in this communication are qualified in their entirety by these cautionary statements and there can be no assurance that the actual results or developments anticipated by AB InBev will be realized or, even if substantially realized, that they will have the expected consequences to, or effects on, AB InBev or its business or operations. Except as required by law, AB InBev undertakes no obligation to publicly update or revise any forward-looking statements, whether as a result of new information, future events or otherwise. The first quarter 2023 (1Q23) financial data set out in Figure 1 (except for the volume information), Figures 3 to 5, 6, 8, 9 and 12 of this press release have been extracted from the group’s unaudited condensed consolidated interim financial statements as of and for the three months ended 31 March 2023, which have been reviewed by our statutory auditors PwC Réviseurs d’Entreprises SRL / PwC Bedrijfsrevisoren BV in accordance with the standards of the Public Company Accounting Oversight Board (United States). Financial data included in Figures 7, 10 and 11 have been extracted from the underlying accounting records as of and for the three months ended 31 March 2023 (except for the volume information). References in this document to materials on our websites, such as www.bees.com, are included as an aid to their location and are not incorporated by reference into this document.
Conference call and webcast
Investor Conference call and webcast on Thursday, 4 May 2023:
3.00pm Brussels / 2.00pm London / 9.00am New York
Registration details:
Webcast (listen-only mode):
AB InBev 1Q23 Results Webcast
To join by phone, please use one of the following two phone numbers:
Toll-Free: 877-407-8029
Toll: 201-689-8029
About Anheuser-Busch InBev (AB InBev)
Anheuser-Busch InBev (AB InBev) is a publicly traded company (Euronext: ABI) based in Leuven, Belgium, with secondary listings on the Mexico (MEXBOL: ANB) and South Africa (JSE: ANH) stock exchanges and with American Depositary Receipts on the New York Stock Exchange (NYSE: BUD). As a company, we dream big to create a future with more cheers. We are always looking to serve up new ways to meet life’s moments, move our industry forward and make a meaningful impact in the world. We are committed to building great brands that stand the test of time and to brewing the best beers using the finest ingredients. Our diverse portfolio of well over 500 beer brands includes global brands Budweiser®, Corona® and Stella Artois®; multi-country brands Beck’s®, Hoegaarden®, Leffe® and Michelob ULTRA®; and local champions such as Aguila®, Antarctica®, Bud Light®, Brahma®, Cass®, Castle®, Castle Lite®, Cristal®, Harbin®, Jupiler®, Modelo Especial®, Quilmes®, Victoria®, Sedrin®, and Skol®. Our brewing heritage dates back more than 600 years, spanning continents and generations. From our European roots at the Den Hoorn brewery in Leuven, Belgium. To the pioneering spirit of the Anheuser & Co brewery in St. Louis, US. To the creation of the Castle Brewery in South Africa during the Johannesburg gold rush. To Bohemia, the first brewery in Brazil. Geographically diversified with a balanced exposure to developed and developing markets, we leverage the collective strengths of approximately 167,000 colleagues based in nearly 50 countries worldwide. For 2022, AB InBev’s reported revenue was 57.8 billion USD (excluding JVs and associates).
Annex 1: Segment reporting
AB InBev Worldwide1Q22ScopeCurrency TranslationOrganic Growth1Q23Organic Growth
Total volumes (thousand hls)139 344--1 204140 5480.9%
of which AB InBev own beer120 58510-465121 0600.4%
Revenue13 235-19-7411 73914 21313.2%
Cost of sales-5 9899301- 839-6 517-14.0%
Gross profit7 246-10-4409007 69612.4%
SG&A-4 116-5200-424-4 344-10.3%
Other operating income/(expenses)164-18-5111527.4%
Normalized EBIT3 294-33-2454873 50314.9%
Normalized EBITDA4 486-33-2996054 75913.6%
Normalized EBITDA margin33.9%33.5%13 bps
North America1Q22ScopeCurrency TranslationOrganic Growth1Q23Organic Growth
Total volumes (thousand hls)24 08716--25023 853-1.0%
Revenue3 8032-241933 9735.1%
Cost of sales-1 563-18-119-1 675-7.6%
Gross profit2 239--16752 2983.3%
SG&A-1 070-2611-53-1 138-4.8%
Other operating income/(expenses)21---138-
Normalized EBIT1 190-26-591 1680.8%
Normalized EBITDA1 378-26-751 3500.3%
Normalized EBITDA margin36.2%34.0%-160 bps
Middle Americas1Q22ScopeCurrency TranslationOrganic Growth1Q23Organic Growth
Total volumes (thousand hls)34 249--2334 2710.1%
Revenue3 098-513403 48911.0%
Cost of sales-1 190--19-147-1 355-12.3%
Gross profit1 908-321932 13310.1%
SG&A-757-4-18-99-878-13.0%
Other operating income/(expenses)2---4-2-
Normalized EBIT1 154-414901 2547.8%
Normalized EBITDA1 450-4241081 5787.4%
Normalized EBITDA margin46.8%45.2%-148 bps
South America1Q22ScopeCurrency TranslationOrganic Growth1Q23Organic Growth
Total volumes (thousand hls)40 394-7-- 10140 286-0.2%
Revenue2 707--4658653 10731.9%
Cost of sales-1 374-151-304-1 526-22.1%
Gross profit1 334--3145611 58142.0%
SG&A-754-7112-230-878-30.2%
Other operating income/(expenses)69-17-389073.5%
Normalized EBIT649-24-20136979359.1%
Normalized EBITDA846-24-2264331 02952.6%
Normalized EBITDA margin31.2%33.1%476 bps
EMEA1Q22ScopeCurrency TranslationOrganic Growth1Q23Organic Growth
Total volumes (thousand hls)20 12443--21019 958-1.0%
Revenue1 79916-1631701 8239.4%
Cost of sales- 914-891-173-1 004-18.8%
Gross profit8858-72-3819-0.3%
SG&A-661-1450-20-645-3.0%
Other operating income/(expenses)38-1-2-351.1%
Normalized EBIT263-7-24-23209-8.8%
Normalized EBITDA500-7-45134622.7%
Normalized EBITDA margin27.8%25.3%-166 bps
Asia Pacific1Q22ScopeCurrency TranslationOrganic Growth1Q23Organic Growth
Total volumes (thousand hls)20 288--1 82622 1149.0%
Revenue1 636-4-1372091 70512.8%
Cost of sales-775-66-114-823-14.7%
Gross profit862-4-709588311.1%
SG&A-467335-20-449-4.2%
Other operating income/(expenses)41--3-632-14.4%
Normalized EBIT435-2-387046516.1%
Normalized EBITDA611-2-516962811.4%
Normalized EBITDA margin37.3%36.8%-47 bps
Global Export and Holding Companies1Q22ScopeCurrency TranslationOrganic Growth1Q23Organic Growth
Total volumes (thousand hls)202-52--8466-55.7%
Revenue191-33-3-39117-24.4%
Cost of sales-17318318-13411.6%
Gross profit18-15--21-18-
SG&A-406439-2-356-0.5%
Other operating income/(expenses)-7---5-12-
Normalized EBIT-396299-28-386-7.5%
Normalized EBITDA-300286-23-288-8.4%
View source version on businesswire.com: https://www.businesswire.com/news/home/20230504005165/en/
CONTACT:
Investors
Shaun Fullalove
Tel: +1 212 573 9287
E-mail: shaun.fullalove@ab-inbev.com
Maria Glukhova
Tel: +32 16 276 888
E-mail: maria.glukhova@ab-inbev.com
Cyrus Nentin
Tel: +1 646 746 9673
E-mail: cyrus.nentin@ab-inbev.com
Media
Kate Laverge
Tel: +1 917 940 7421
E-mail: kate.laverge@ab-inbev.com
Ana Zenatti
Tel: +1 646 249 5440
E-mail: ana.zenatti@ab-inbev.com
Michaël Cloots
Tel: +32 497 167 183
E-mail: michael.cloots@ab-inbev.com
ABI Strategic Priorities (Graphic: Business Wire)
本文链接:http://www.iruis.com/News/cninfo/65746.shtml


热门资讯

商汤公布2022业绩:营业收入38亿元,亏损净额收窄…
点击:127

蕉下遭消费者投诉,太阳镜存在质量问题
点击:124

半月内两次“翻车”, 片仔癀牙膏涉菌落总数超标1…
点击:119
蚂蚁金服前高管涉嫌强奸被立案 集团回应称已经离职
点击:117

靠卖牌子,毛戈平一年赚了16.8亿
点击:117

浪琴表携2023新品时计亮相第三届中国消博会
点击:113
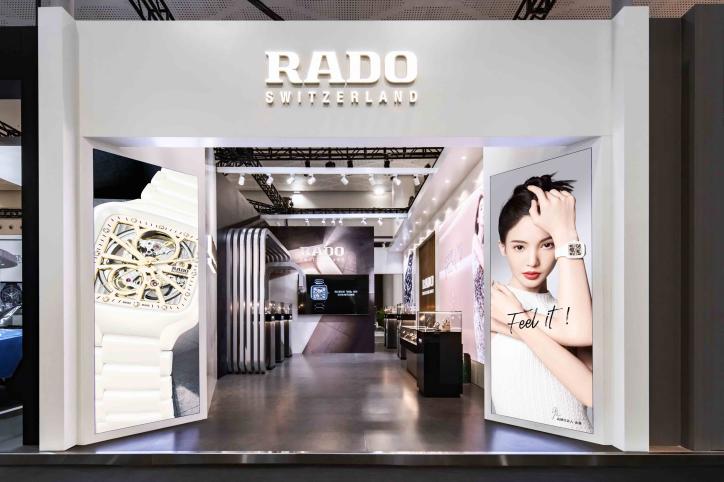
Rado瑞士雷达表亮相第三届中国国际消费品博览会
点击:113

外卖骑手出现人多单少 平台称人员增减属于正常现象
点击:113

新能源价格战时代,长城汽车如何内外兼修?
点击:113

特斯拉上海工厂被爆恶意克扣员工绩效奖引不满
点击:112