AB InBev Reports Second Quarter 2025 Results
ConsistentexecutionofourstrategydeliveredanEBITDAincreaseof6.5%,continuedmarginexpansionandhigh-singledigitUnderlyingEPSgrowth
BRUSSELS--(BUSINESSWIRE)--Anheuser-BuschInBev(Brussel:ABI)(BMV:ANB)(JSE:ANH)(NYSE:BUD):
Regulatedinformation1
“Beerisapassionpointforconsumers.Theresilienceofthebeercategoryandthecontinuedmomentumofourmegabrandsdeliveredanotherquarterofprofitablegrowth.EBITDAincreasedby6.5%andtheongoingoptimizationofourbusinessdroveUnderlyingEPSgrowthof8.7%.Whiletheoperatingenvironmentremainsdynamic,theconsistentexecutionofourstrategybyourteamsandpartnersdroveasolidfirsthalfoftheyearandreinforcesourconfidenceindeliveringonouroutlookfor2025.”–MichelDoukeris,CEO,ABInBev
Revenue
+3.0%
Revenueincreasedby3.0%in2Q25withrevenueperhlgrowthof4.9%andby2.3%inHY25withrevenueperhlgrowthof4.3%.
Reportedrevenuedecreasedby2.1%in2Q25to15004millionUSDandby4.2%inHY25to28632millionUSD,impactedbyunfavorablecurrencytranslation.
5.6%increaseincombinedrevenuesofourmegabrands,ledbyCorona,whichgrewby7.7%outsideofitshomemarketin2Q25.
33%increaseinrevenueofourno-alcoholbeerportfolioin2Q25.
63%increaseinGrossMerchandiseValue(GMV)fromsalesofthird-partyproductsthroughBEESMarketplacetoreach785millionUSDin2Q25.
Volumes
-1.9%
Volumesdeclinedby1.9%in2Q25,withbeervolumesdownby2.2%andnon-beervolumesupby0.3%.
Volumesdeclinedby2.0%inHY25,withbeervolumesdownby2.3%andnon-beervolumesflat.
NormalizedEBITDA
+6.5%
NormalizedEBITDAincreasedby6.5%to5301millionUSDin2Q25,withamarginexpansionof116bpsto35.3%.NormalizedEBITDAincreasedby7.2%to10156millionUSDinHY25,withamarginexpansionof166bpsto35.5%.
UnderlyingProfit
1950millionUSD
UnderlyingProfitwas1950millionUSDin2Q25comparedto1811millionUSDin2Q24andwas3556millionUSDinHY25comparedto3320millionUSDinHY24.
ReportedprofitattributabletoequityholdersofABInBevwas1676millionUSDin2Q25comparedto1472millionUSDin2Q24,negativelyimpactedbynon-underlyingitems,andwas3824millioninHY25comparedto2564millioninHY24,positivelyimpactedbynon-underlyingitems.
UnderlyingEPS
0.98USD
UnderlyingEPSincreasedby8.7%to0.98USDin2Q25,comparedto0.90USDin2Q24,andincreasedby8.0%to1.79USDinHY25,comparedto1.66USDinHY24.
Onaconstantcurrencybasis,UnderlyingEPSincreasedby17.4%in2Q25andby18.7%inHY25.
NetDebttoEBITDA
3.27x
NetdebttonormalizedEBITDAratiowas3.27xat30June2025comparedto3.42xat30June2024and2.89xat31December24.
The2025HalfYearFinancialReportisavailableonourwebsiteatwww.ab-inbev.com
1TheenclosedinformationconstitutesregulatedinformationasdefinedintheBelgianRoyalDecreeof14November2007regardingthedutiesofissuersoffinancialinstrumentswhichhavebeenadmittedfortradingonaregulatedmarket.Forimportantdisclaimersandnotesonthebasisofpreparation,pleaserefertopage16.
Managementcomments
ConsistentexecutionofourstrategydeliveredanEBITDAincreaseof6.5%,continuedmarginexpansionandhigh-singledigitUnderlyingEPSgrowth
Our2Q25andHY25resultsdemonstratetheresilienceofourstrategyandabilityofourbusinesstodeliverreliablecompoundinggrowth.In2Q25,increasedinvestmentsinourbrands,expansionofourpremiumportfolioandinnovationinbalancedchoices,combinedwithourrevenuemanagementdecisionsdroveanaccelerationinrevenuegrowth,top-andbottomlineincreasesinfourofourfiveoperatingregionsandcontinuedgrowthinouroverallportfoliobrandpower.
Revenueincreasedin70%ofourmarketsandby3.0%overall,drivenbyarevenueperhlincreaseof4.9%.Volumesdeclinedby1.9%,impactedbysoftindustriesandperformanceinChinaandBrazil.Whileoverallvolumeswerebelowpotential,underlyingmomentumcontinuedintheremainderofourfootprint,withvolumegrowthof0.7%outsideofthesetwocountries.Top-linegrowthcombinedwithdisciplinedresourceallocationandoverheadmanagementdroveanEBITDAincreaseof6.5%,marginexpansionof116bpsandUnderlyingEPSgrowthof17.4%inconstantcurrencyand8.7%inUSDtoreach0.98USD.
Progressingourstrategicpriorities
Wecontinuetoexecuteonandinvestinthreekeystrategicpillarstodeliverconsistentgrowthandlong-termvaluecreation.
(1)Leadandgrowthecategory:
Ouroverallportfoliobrandpowergrewin2Q25drivenbyincreasedmarketinginvestmentandeffectiveness.Inaddition,weestimatethatwegainedormaintainedmarketsharein60%ofourmarketsinHY25.
(2)Digitizeandmonetizeourecosystem:
BEESMarketplacecaptured785millionUSDinGMVfromsalesofthird-partyproducts,a63%increaseversus2Q24.OverallBEESGMVincreasedby10%versus2Q24,reaching12.2billionUSD.
(3)Optimizeourbusiness:
WecontinuedtomakeprogressondeleveragingwithnetdebttoEBITDAreaching3.27xasof30June2025versus3.42xasof30June2024.InHY25,weinvested5.0billionUSDincapexandsalesandmarketingwhiledeliveringfreecashflowofapproximately1.4billionUSD,a0.5billionUSDincreaseversusHY24.
(1)Leadandgrowthecategory
Ourperformanceacrosseachofourcategoryexpansionleversdroveanestimatedincreaseinthepercentageoflegaldrinkingageconsumerspurchasingourportfolioacrossourkeymarkets,withincreasesledbyourmegabrandsandno-alcoholbeerportfolio.Wecontinuetoinvestinourmegabrandsandmegaplatformswithoursalesandmarketinginvestmentsincreasingto3.6billionUSDinHY25,a4%increaseversusHY24.AccordingtotheKantarBrandZ2025report,ourportfolioholds8ofthetop10mostvaluablebeerbrandsintheworld,withCoronaandBudweiser#1and#2respectively.OurmarketingeffectivenessandcreativitywererecognizedbybeingnamedthemosteffectivemarketerintheworldbybothEffiesandtheWorldAdvertisingResearchCenterforthe4thyearinarow.
CoreSuperiority:Revenueofourmainstreamportfolioincreasedby0.4%in2Q25,drivenbyhigh-singledigitgrowthinPeruandmid-singledigitgrowthinColombiaandMexico.
Premiumization:Coronaledourpremiumperformancein2Q25,increasingrevenueby7.7%outsideofMexicowithdouble-digitvolumegrowthinmorethan30markets.Ouroverallabovecorebeerportfoliodelivereda5.1%revenueincrease.
BalancedChoices:Growthin2Q25wasledbyourno-alcoholbeerportfoliowhichdelivereda33%revenueincreaseandisestimatedtohavegainedshareofno-alcoholbeeracrossourfootprint,ledbyCoronaCerowhichnearlydoubledvolumesversus2Q24.Ouroverallbalancedchoicesportfoliooflowcarb,sugarfree,glutenfreeandno-andlow-alcoholbeerbrandsdeliveredarevenueincreaseof7.9%.
BeyondBeer:ThemomentumofourBeyondBeerportfoliocontinuedin2Q25,ledbythedouble-digitrevenuegrowthofCutwaterintheUSandBeatsinBrazilwhichdroveanoverallrevenueincreaseof6.4%.
(2)Digitizeandmonetizeourecosystem
Digitizingourrelationshipswithmorethan6millioncustomersglobally:Asof30June2025,BEESwaslivein28marketswith71%ofourrevenuescapturedthroughB2Bdigitalplatforms.In2Q25,BEEScaptured12.2billionUSDinGMV,growthof10%versus2Q24.
Monetizingourroute-to-market:BEESMarketplaceGMVgrowthacceleratedin2Q25,growingby63%versus2Q24toreach785millionUSDfromsalesofthird-partyproducts.
LeadingthewayinDTCsolutions:OuromnichannelDTCecosystemofdigitalandphysicalproductsgeneratedrevenueofapproximately335millionUSDin2Q25.OurDTCmegabrands,ZéDelivery,TaDaDeliveryandPerfectDraft,generated18.2millione-commerceordersanddelivered134millionUSDinrevenuethisquarter,representing6%growthversus2Q24.
(3)Optimizeourbusiness
Maximizingvaluecreation:EBITDAgrewby6.5%andEBITby10.2%in2Q25asdisciplinedresourceallocationandoverheadmanagementdrovecontinuedmarginexpansion.Thecombinationoftheoptimizationofournetfinancecostsandnetworkingcapital,andimprovedcapexefficiencydeliveredfreecashflowofapproximately1.4billionUSDinHY25,a0.5billionUSDimprovementversusHY24.WecontinuedtoprogressonourdeleveragingwithournetdebttoEBITDAratioreaching3.27xversus3.42xasof30June2024.Asistypical,theratioincreasedversusFY24duetotheseasonalityofourcashflowgenerationandcashoutflowforourincreasedfullyeardividendandsharebuybackprogram.
Advancingoursustainabilitypriorities:InClimateAction,ourScopes1and2emissionsperhectoliterofproductionwas4.30kgCO2e/hlinHY25,areductionof47%versusour2017baseline.InWaterStewardship,ourwateruseefficiencyratioimprovedto2.40hlperhlinHY25versus2.50hlperhlinHY24.
Deliveringreliablecompoundinggrowth
Inthefirsthalfofthisyear,ourbusinessdeliveredanEBITDAincreaseof7.2%withmarginexpansionof166bpsandUnderlyingEPSgrowthof8.0%inUSD.Wemadestrategicchoicesacrossrevenuemanagement,resourceallocation,andincreasedsalesandmarketinginvestmentstoleadandgrowthecategory.Wecontinuedtomakeprogressondeleveragingwhilepayinganincreaseddividendtoourshareholdersandcompletingour2billionUSDsharebuybackprogram.Ourfootprinthasstructuraltailwindsforlong-termvolumegrowthwithfavorabledemographics,ongoingeconomicdevelopmentandopportunitiestoincreasecategoryparticipation.OurconsistentperformanceandthefundamentalstrengthsofourbusinessreinforceourconfidenceinourabilitytodeliverourFY25outlookandlong-termvaluecreation.
2025Outlook
(i)OverallPerformance:WeexpectourEBITDAtogrowinlinewithourmedium-termoutlookofbetween4-8%.TheoutlookforFY25reflectsourcurrentassessmentofinflationandothermacroeconomicconditions.
(ii)NetFinanceCosts:Netpensioninterestexpensesandaccretionexpensesareexpectedtobeintherangeof190to220millionUSDperquarter,dependingoncurrencyandinterestratefluctuations.WeexpecttheaveragegrossdebtcouponinFY25tobeapproximately4%.
(iii)EffectiveTaxRate(ETR):WeexpectthenormalizedETRinFY25tobeintherangeof26%to28%.TheETRoutlookdoesnotconsidertheimpactofpotentialfuturechangesinlegislation.
(iv)NetCapitalExpenditure:Weexpectnetcapitalexpenditureofbetween3.5and4.0billionUSDinFY25.
Figure1.Consolidatedperformance
inUSDMio,exceptEPSinUSDpershareandVolumesinthousandhls
2Q24
2Q25
Organic
growth
Volumes
146302
143347
(1.9
)%
Beer
127242
124778
(2.2
)%
Non-Beer
19059
18569
0.3
%
Revenue
15333
15004
3.0
%
Grossprofit
8567
8446
4.0
%
Grossmargin
55.9
%
56.3
%
55bps
NormalizedEBITDA
5302
5301
6.5
%
NormalizedEBITDAmargin
34.6
%
35.3
%
116bps
NormalizedEBIT
3905
4013
10.2
%
NormalizedEBITmargin
25.5
%
26.7
%
179bps
ProfitattributabletoequityholdersofABInBev
1472
1676
UnderlyingProfit
1811
1950
BasicEPS
0.73
0.84
UnderlyingEPS
0.90
0.98
HY24
HY25
Organic
growth
Volumes
285837
279615
(2.0
)%
Beer
246767
241390
(2.3
)%
Non-Beer
39070
38225
0.0
%
Revenue
29880
28632
2.3
%
Grossprofit
16461
16029
4.6
%
Grossmargin
55.1
%
56.0
%
127bps
NormalizedEBITDA
10288
10156
7.2
%
NormalizedEBITDAmargin
34.4
%
35.5
%
166bps
NormalizedEBIT
7547
7601
10.3
%
NormalizedEBITmargin
25.3
%
26.5
%
198bps
ProfitattributabletoequityholdersofABInBev
2564
3824
UnderlyingProfit
3320
3556
BasicEPS
1.28
1.92
UnderlyingEPS
1.66
1.79
Figure2.Volumes
inthousandhls
2Q24
Scope
Organic
2Q25
Organicgrowth
growth
Total
Beer
NorthAmerica
22639
(330
)
68
22376
0.3
%
(0.0
)%
MiddleAmericas
38381
-
441
38822
1.1
%
1.5
%
SouthAmerica
35969
-
(1770
)
34199
(4.9
)%
(6.8
)%
EMEA
23852
112
208
24172
0.9
%
0.6
%
AsiaPacific
25399
-
(1683
)
23716
(6.6
)%
(6.5
)%
GlobalExportandHoldingCompanies
62
(6
)
6
62
10.4
%
10.4
%
ABInBevWorldwide
146302
(224
)
(2730
)
143347
(1.9
)%
(2.2
)%
HY24
Scope
Organic
HY25
Organicgrowth
growth
Total
Beer
NorthAmerica
43992
(474
)
(1299
)
42218
(3.0
)%
(3.2
)%
MiddleAmericas
74072
-
(169
)
73903
(0.2
)%
0.1
%
SouthAmerica
76315
-
(1226
)
75089
(1.6
)%
(2.5
)%
EMEA
44882
77
(35
)
44924
(0.1
)%
(0.4
)%
AsiaPacific
46444
(93
)
(2987
)
43365
(6.4
)%
(6.3
)%
GlobalExportandHoldingCompanies
132
(9
)
(7
)
116
(5.7
)%
(5.7
)%
ABInBevWorldwide
285837
(498
)
(5724
)
279615
(2.0
)%
(2.3
)%
KeyMarketsPerformance
UnitedStates:MichelobUltramomentumdrovecontinuedmarketsharegainandtop-andbottom-linegrowth
Operatingperformance:
2Q25:Revenuegrewby2.1%withrevenueperhlincreasingby1.8%drivenbyrevenuemanagementinitiativesandpremiumization.Sales-to-retailers(STRs)declinedby2.1%,estimatedtohaveoutperformedasoftindustry.Sales-to-wholesalers(STWs)grewby0.2%.EBITDAincreasedby4.2%drivenbytop-linegrowthandproductivityinitiatives,evenaswecontinuedtoincreaseourmarketinginvestmentstofuelmomentum.
HY25:Revenuedeclinedby1.5%,withrevenueperhlincreasingby1.8%.STRsdeclinedby3.5%andSTWsweredownby3.2%,andweexpectourSTRsandSTWstoconvergeonafullyearbasis.EBITDAincreasedby1.4%.
Commercialhighlights:Increasedinvestmentandconsistentexecutiondroveourmomentumwithourportfoliocontinuingtogainmarketshareofthebeerindustry,accordingtoCircana.OurperformancewasledbyMichelobUltraandBuschLight,whichcontinuedtobethe#1and#2volumesharegainersintheindustry.Wearetheleadersinno-alcoholbeer,withourportfoliogrowingvolumesinthehigh-twenties,andweareleadingtheindustryininnovationwithMichelobUltraZeroandBuschLightApplethetop2innovationsinthebeerindustryyear-to-date.InBeyondBeer,ourspirits-basedRTDportfoliodeliveredlow-teensvolumegrowth,ledbyCutwaterandNütrl.
Mexico:Continuedmomentumdrovemid-singledigittop-andbottom-linegrowth
Operatingperformance:
2Q25:Revenueincreasedbymid-singledigits,withlow-singledigitrevenueperhlgrowthdrivenbyrevenuemanagementinitiatives.Volumesincreasedbylow-singledigits,slightlyoutperformingtheindustrywhichbenefittedfromEastershipmentphasinginAprilbutwasnegativelyimpactedbyadverseweatherinJune.EBITDAgrewbymid-singledigits.
HY25:Revenuegrewbymid-singledigitswithrevenueperhlgrowthofmid-singledigitsandvolumesincreasingbylow-singledigits.EBITDAgrewbyhigh-singledigitswithmarginexpansion.
Commercialhighlights:Ourperformancewasledbyourabovecorebeerportfolio,whichgrewrevenuebyhigh-singledigitsdrivenbyModeloandMichelobUltra,whileourcorebeerbrandsdeliveredmid-singledigitrevenuegrowth.Weareleadingthegrowthinno-alcoholbeerwithCoronaCerogrowingvolumebystrongdouble-digitsandnowthe#1no-alcoholbeerbrandinthecountry,accordingtoNielsen.Wecontinuedtoprogressourdigitalinitiatives,withBEESMarketplacegrowingGMVby30%versus2Q24andourdigitalDTCplatform,TaDaDelivery,fulfillingmorethan1.2millionorders,a6%increaseversus2Q24.
Colombia:Recordhighvolumedrovehighsingle-digittop-andbottom-linegrowth
Operatingperformance:
2Q25:Revenueincreasedbyhigh-singledigitswithmid-singledigitrevenueperhlgrowth,drivenbyrevenuemanagementinitiatives.Volumesgrewbylow-singledigits,withourportfolioestimatedtohavegainedshareoftotalalcohol.EBITDAgrewbyhigh-singledigitswithmarginexpansion.
HY25:Revenuegrewbymid-singledigitswithmid-singledigitrevenueperhlgrowth.Volumesincreasedbylow-singledigits.EBITDAgrewbylow-teenswithmarginexpansion.
Commercialhighlights:Ourabovecorebeerbrandsledourperformance,deliveringmid-singledigitvolumegrowthanddrivingrecordhighsecondquartervolumes.Ourcorebeerportfoliodeliveredamid-singledigitrevenueincreasedrivenbyAguila.
Brazil:Revenuedeclinedby1.9%impactedbyvolume;disciplinedrevenueandcostmanagementdrovemid-singledigitbottom-linegrowthwithmarginexpansion
Operatingperformance:
2Q25:Revenuedeclinedby1.9%withrevenueperhlgrowthof4.9%drivenbyrevenuemanagementinitiativesandpremiumization.Totalvolumesdeclinedby6.5%,withbeervolumedecreasingby9.0%,cyclingastrongperformancein2Q24andunderperformingasoftindustry,whichwasprimarilyimpactedbyadverseweather.Non-beervolumesgrewby0.3%.EBITDAincreasedby5.3%withmarginexpansionof216bpsasproductivityinitiativesandSG&AefficienciesmorethanoffsettransactionalFXheadwinds.
HY25:Revenuegrewby1.5%withrevenueperhlgrowthof4.0%.Totalvolumesdeclinedby2.4%withbeervolumesdecliningby4.0%andnon-beervolumesincreasingby1.9%.EBITDAincreasedby9.7%withmarginexpansionof254bps.
Commercialhighlights:Ourpremiumandsuperpremiumbeerbrandsledourperformancein2Q25,deliveringmid-teensvolumegrowth,drivenbyCoronaandOriginal.Ourportfolioofbalancedchoicesdroveincrementalgrowthwithvolumesofourno-alcoholbeerbrandsincreasingbymid-teensandStellaArtoisGlutenFreemorethandoubling.Wecontinuetoinvesttoincreasethebrandpowerofourportfolio,mainstreamvolumeshoweverdeclinedthisquarter,impactedbyasoftindustry.Non-beerperformancewasdrivenbyourlow-andno-sugarportfolio,whichgrewvolumesinthelow-thirties.Wecontinuedtoprogressourdigitalinitiatives,withBEESMarketplaceGMVmorethandoublingversus2Q24,andourdigitalDTCplatform,ZéDelivery,reaching5.3millionmonthlyactiveusers.
Europe:Improvedindustry,continuedpremiumizationandmarginrecoverydeliveredtop-andbottom-linegrowth
Operatingperformance:
2Q25:Revenuegrewbylow-singledigitswithlow-singledigitrevenueperhlgrowthdrivenbycontinuedpremiumization.Volumeswereflat,supportedbyestimatedmarketsharegainsin5ofour6keymarketsandanimprovedindustryasweathernormalized.EBITDAgrewbylow-singledigitswithmarginrecovery.
HY25:Revenuewasflattishwithlow-singledigitrevenueperhlgrowth.Volumedeclinedbylow-singledigits,estimatedtohaveoutperformedtheindustryin5ofour6keymarkets.EBITDAgrewbymid-singledigitswithmarginrecovery.
Commercialhighlights:Industryvolumesinourfootprintwereestimatedtobeflattishthisquarter,improvingsequentiallyversus1Q25,withbeergainingshareoftotalalcohol.Wecontinuedtopremiumizeourportfolio,withourpremiumandsuperpremiumportfoliomakingup62%ofour2Q25revenue.Ourperformancewasdrivenbyourmegabrands,ledbyCorona,whichgrewvolumebydouble-digits,andStellaArtois,whichsuccessfullyactivatedthePerfectServecampaignattheRolandGarrosandWimbledontennistournaments.Ourno-alcoholbeerportfoliogrewvolumesby31%,ledbyCoronaCerowhichdeliveredstrongdouble-digitvolumegrowth.
SouthAfrica:Continuedmomentumandmarketsharegaindeliveredmid-singledigittop-andbottom-linegrowth
Operatingperformance:
2Q25:Revenueincreasedbymid-singledigitswithrevenueperhlgrowthoflow-singledigits.Volumesgrewbymid-singledigits,estimatedtohaveoutperformedtheindustryinbothbeerandBeyondBeerwhichwassupportedbyEastershipmentphasing.EBITDAgrewbymid-singledigitswithmarginexpansion.
HY25:Revenueincreasedbymid-singledigitswithrevenueperhlgrowthoflow-singledigits.Volumesgrewbylow-singledigits,estimatedtohaveoutperformedtheindustryinbothbeerandBeyondBeer.EBITDAgrewbymid-singledigits.
Commercialhighlights:Performancein2Q25wasledbyourpremiumandsuperpremiumbeerbrands,whichgrewvolumesbymid-teensdrivenbyCoronaandStellaArtois,andthecontinuedstrengthofourcorebrandswhichdeliveredlow-singledigitvolumegrowth.InBeyondBeer,ourportfoliogrewvolumesbymid-singledigits.
China:Revenuedeclinedby6.2%impactedbyvolumeperformance
Operatingperformance:
2Q25:Volumesdeclinedby7.4%,underperformingtheindustryaccordingtoourestimates,withourperformanceimpactedbycontinuedweaknessinourkeyregionsandchannels.Revenueperhlincreasedby1.3%drivenbypositivebrandmix,resultinginarevenuedeclineof6.2%.EBITDAdeclinedby3.4%astop-lineperformancewaspartiallyoffsetbyproductivityinitiativesandSG&Aefficiencieswhilewecontinuedtoincreasemarketinginvestments.
HY25:Revenuedeclinedby9.4%withrevenueperhldecliningby1.3%andvolumesdecreasingby8.2%.EBITDAdeclinedby9.6%.
Commercialhighlights:Industryvolumeswereestimatedtohavedeclinedbylow-singledigitsversus2Q24.Weremainfocusedonexecutingourstrategy,centeredonpremiumization,channelandgeographicexpansion,anddigitaltransformation.Wecontinuedtostrengthenourexecutioninthein-homechannel,increasingourmarketinginvestmentsandacceleratingourchannelexpansion.In2Q25,ourmarketingactivationsincludedanewintegratedcampaignforBudweiserwiththeFIFAClubWorldCupandupdatedbrandimageryforHarbin.TheBEESplatformispresentinmorethan320cities,enablingustooptimizeourroutetoconsumerandstrengthenourcustomerrelationships.
Highlightsfromourothermarkets
Canada:Volumesgrewbylow-singledigitsthisquarter,estimatedtohaveoutperformedanimprovedbeerindustry.Revenuegrewbylow-singledigitswithlow-singledigitrevenueperhlgrowth.OurperformancewasledbyMichelobUltra,BuschandCoronawhichwereestimatedtobethreeofthetopfivevolumesharegainersintheindustry.
Peru:Revenuegrewbyhigh-singledigitsin2Q25withmid-singledigitrevenueperhlgrowth,drivenbyrevenuemanagementinitiatives.Volumesgrewbymid-singledigits,asthebeerindustryreturnedtogrowthsupportedbynormalizedweatherandEastershipmentphasing.
Ecuador:Revenuegrewbymid-singledigitsin2Q25withvolumesincreasingbylow-singledigits.Growthwasledbyourabovecorebeerbrandswhichincreasedvolumebyhigh-teens.
Argentina:Volumetrendsimprovedsequentially,decliningbylow-singledigitsthisquarter.Beervolumesgrewbylow-singledigitsastheindustryreturnedtogrowth,despiteoverallconsumerdemandcontinuingtobeimpactedbyinflationarypressures.Since1Q24,thedefinitionoforganicrevenuegrowthinArgentinahasbeenamendedtocapthepricegrowthtoamaximumof2%permonth.Revenuegrewbymid-twentiesonthisbasis.
AfricaexcludingSouthAfrica:InNigeria,revenuegrewbystrongdouble-digitsin2Q25,drivenbyrevenuemanagementinitiativesinahighlyinflationaryenvironment.Beervolumesdeclinedbylow-teens,impactedbyasoftindustryandcyclingastrongperformancein2Q24.InourothermarketsinAfrica,wegrewvolumeinaggregatebylow-singledigits,drivenbyTanzaniaandMozambique.
SouthKorea:Revenuedeclinedbyhigh-singledigitsin2Q25withlow-singledigitrevenueperhlgrowthdrivenbyrevenuemanagementinitiatives.Whilewecontinuedtogainmarketshareinboththeon-premiseandin-homechannels,volumeswerenegativelyimpactedbyshipmentphasingaheadofourAprilpriceincreaseanddeclinedbyhigh-singledigits.
ConsolidatedIncomeStatement
Figure3.Consolidatedincomestatement
inUSDMio
2Q24
2Q25
Organic
growth
Revenue
15333
15004
3.0
%
Costofsales
(6766
)
(6558
)
(1.7
)%
Grossprofit
8567
8446
4.0
%
SG&A
(4813
)
(4624
)
0.0
%
Otheroperatingincome/(expenses)
151
191
35.2
%
NormalizedEBIT
3905
4013
10.2
%
Non-underlyingitemsaboveEBIT
(90
)
(45
)
Netfinanceincome/(expense)
(1170
)
(1062
)
Non-underlyingnetfinanceincome/(expense)
(221
)
(234
)
Shareofresultsofassociates
79
84
Non-underlyingshareofresultsofassociates
-
9
Incometaxexpense
(752
)
(741
)
Profit
1751
2024
Profitattributabletonon-controllinginterest
279
347
ProfitattributabletoequityholdersofABInBev
1472
1676
NormalizedEBITDA
5302
5301
6.5
%
UnderlyingProfit
1811
1950
HY24
HY25
Organic
growth
Revenue
29880
28632
2.3
%
Costofsales
(13419
)
(12602
)
0.7
%
Grossprofit
16461
16029
4.6
%
SG&A
(9248
)
(8812
)
(0.6
)%
Otheroperatingincome/(expenses)
334
383
20.8
%
NormalizedEBIT
7547
7601
10.3
%
Non-underlyingitemsaboveEBIT
(119
)
(94
)
Netfinanceincome/(expense)
(2357
)
(2046
)
Non-underlyingnetfinanceincome/(expense)
(530
)
368
Shareofresultsofassociates
137
135
Non-underlyingshareofresultsofassociates
104
9
Incometaxexpense
(1546
)
(1404
)
Profit
3236
4568
Profitattributabletonon-controllinginterest
672
744
ProfitattributabletoequityholdersofABInBev
2564
3824
NormalizedEBITDA
10288
10156
7.2
%
UnderlyingProfit
3320
3556
Non-underlyingitemsaboveEBIT&Non-underlyingshareofresultsofassociates
Figure4.Non-underlyingitemsaboveEBIT&Non-underlyingshareofresultsofassociates
inUSDMio
2Q24
2Q25
HY24
HY25
Restructuring
(28
)
(35
)
(59
)
(47
)
Businessandassetdisposal(incl.impairmentlosses)
(62
)
(10
)
(60
)
(47
)
Non-underlyingitemsinEBIT
(90
)
(45
)
(119
)
(94
)
Non-underlyingshareofresultsofassociates
-
9
104
9
NormalizedEBITexcludesnegativenon-underlyingitemsof45millionUSDin2Q25and94millionUSDinHY25.Non-underlyingshareofresultsfromassociatesofHY24includedtheimpactfromourassociateAnadoluEfes’adoptionofIAS29hyperinflationaccountingontheir2023results.
Netfinanceincome/(expense)
Figure5.Netfinanceincome/(expense)
inUSDMio
2Q24
2Q25
HY24
HY25
Netinterestexpense
(721
)
(663
)
(1399
)
(1284
)
Accretionexpenseandinterestonpensions
(214
)
(184
)
(427
)
(351
)
Otherfinancialresults
(235
)
(214
)
(530
)
(410
)
Netfinanceincome/(expense)
(1170
)
(1062
)
(2357
)
(2046
)
Non-underlyingnetfinanceincome/(expense)
Figure6.Non-underlyingnetfinanceincome/(expense)
inUSDMio
2Q24
2Q25
HY24
HY25
Mark-to-market
(264
)
(263
)
(507
)
339
Gain/(loss)onbondredemptionandother
43
29
(23
)
29
Non-underlyingnetfinanceincome/(expense)
(221
)
(234
)
(530
)
368
Non-underlyingnetfinancecostin2Q25includesmark-to-marketlossesonderivativeinstrumentsenteredintoinordertohedgeourshare-basedpaymentprogramsandsharesissuedinrelationtothecombinationwithGrupoModeloandSAB.
Thenumberofsharescoveredbythehedgingofourshare-basedpaymentprogram,thedeferredshareinstrumentandtherestrictedsharesareshownbelow,togetherwiththeopeningandclosingshareprices.
Figure7.Non-underlyingequityderivativeinstruments
2Q24
2Q25
HY24
HY25
Sharepriceatthestartoftheperiod(Euro)
56.46
56.92
58.42
48.25
Sharepriceattheendoftheperiod(Euro)
54.12
58.24
54.12
58.24
Numberofequityderivativeinstrumentsattheendoftheperiod(millions)
100.5
100.5
100.5
100.5
Incometaxexpense
Figure8.Incometaxexpense
inUSDMio
2Q24
2Q25
HY24
HY25
Incometaxexpense
752
741
1546
1404
Effectivetaxrate
31.0
%
27.7
%
34.1
%
24.1
%
Normalizedeffectivetaxrate
27.4
%
25.3
%
27.2
%
25.6
%
TheHY25effectivetaxratewaspositivelyimpactedbynon-taxablegainsfromderivativesrelatedtothehedgingofshare-basedpaymentprogramsandofthesharesissuedinatransactionrelatedtothecombinationswithGrupoModeloandSAB,whiletheHY24effectivetaxratewasnegativelyimpactedbynon-deductiblelossesfromthesederivatives.Furthermore,HY24effectivetaxrateincluded133millionUSDofnon-underlyingtaxexpense.
ThedecreaseinNormalizedETRin2Q25comparedto2Q24andHY25comparedtoHY24isdrivenmainlybycountrymix.
UnderlyingEPS
Figure9.UnderlyingEPS
inUSDpershare,exceptnumberofsharesinmillion
2Q24
2Q25
HY24
HY25
NormalizedEBITDA
2.64
2.67
5.13
5.11
Depreciation,amortizationandimpairment
(0.70
)
(0.65
)
(1.37
)
(1.28
)
NormalizedEBIT
1.95
2.02
3.76
3.82
Netfinanceincome/(expense)
(0.58
)
(0.53
)
(1.18
)
(1.03
)
Incometaxexpense
(0.37
)
(0.38
)
(0.70
)
(0.71
)
Associates&non-controllinginterests
(0.10
)
(0.13
)
(0.27
)
(0.31
)
Hyperinflationimpacts
0.01
0.01
0.04
0.02
UnderlyingEPS
0.90
0.98
1.66
1.79
Weightedaveragenumberofordinaryandrestrictedshares
2005
1989
2005
1989
ReconciliationofIFRSandNon-IFRSFinancialMeasures
ProfitattributabletoequityholdersandUnderlyingProfit
Figure10.UnderlyingProfit
inUSDMio
2Q24
2Q25
HY24
HY25
ProfitattributabletoequityholdersofABInBev
1472
1676
2564
3824
Netimpactofnon-underlyingitemsonprofit
313
261
675
(305
)
Hyperinflationimpacts
26
14
81
37
UnderlyingProfit
1811
1950
3320
3556
BasicandUnderlyingEPS
Figure11.BasicandUnderlyingEPS
inUSDpershare,exceptnumberofsharesinmillion
2Q24
2Q25
HY24
HY25
BasicEPS
0.73
0.84
1.28
1.92
Netimpactofnon-underlyingitems
0.16
0.13
0.34
(0.15
)
Hyperinflationimpacts
0.01
0.01
0.04
0.02
UnderlyingEPS
0.90
0.98
1.66
1.79
FXtranslationimpact
-
0.08
-
0.17
UnderlyingEPSinconstantcurrency
0.90
1.06
1.66
1.96
Weightedaveragenumberofordinaryandrestrictedshares
2005
1989
2005
1989
ProfitattributabletoequityholdersandNormalizedEBITDA
Figure12.ReconciliationofNormalizedEBITDAtoProfitattributabletoequityholdersofABInBev
inUSDMio
2Q24
2Q25
HY24
HY25
ProfitattributabletoequityholdersofABInBev
1472
1676
2564
3824
Non-controllinginterests
279
347
672
744
Profit
1751
2024
3236
4568
Incometaxexpense
752
741
1546
1404
Shareofresultofassociates
(79
)
(84
)
(137
)
(135
)
Non-underlyingshareofresultsofassociates
-
(9
)
(104
)
(9
)
Netfinance(income)/expense
1170
1062
2357
2046
Non-underlyingnetfinance(income)/expense
221
234
530
(368
)
Non-underlyingitemsaboveEBIT(incl.impairmentlosses)
90
45
119
94
NormalizedEBIT
3905
4013
7547
7601
Depreciation,amortizationandimpairment
1397
1288
2741
2555
NormalizedEBITDA
5302
5301
10288
10156
NormalizedEBITDA,NormalizedEBITandUnderlyingProfitarenon-IFRSfinancialmeasuresusedbyABInBevtoreflectthecompany’sunderlyingperformance.UnderlyingEPSandconstantcurrencyUnderlyingEPSarenon-IFRSfinancialmeasuresthatABInBevbelievesareusefultoinvestorsbecausetheyfacilitatecomparisonsofEPSfromperiodtoperiod.
NormalizedEBITDAiscalculatedbyadjustingprofitattributabletoequityholdersofABInBevtoexclude:(i)non-controllinginterest;(ii)incometaxexpense;(iii)shareofresultsofassociates;(iv)non-underlyingshareofresultsofassociates;(v)netfinanceincomeorcost;(vi)non-underlyingnetfinanceincomeorcost;(vii)non-underlyingitemsaboveEBIT;and(viii)depreciation,amortizationandimpairment.
UnderlyingProfitiscalculatedbyadjustingprofitattributabletoequityholdersofABInBevtoexclude:(i)non-underlyingitemsand(ii)hyperinflationimpacts.UnderlyingEPSiscalculatedasUnderlyingProfitdividedbytheweightedaveragenumberofordinaryandrestrictedshares.ConstantcurrencyUnderlyingEPSiscalculatedasUnderlyingEPSexcludingtheeffectsofforeigncurrencytranslationbytranslatingcurrentperiodfiguresusingtheexchangeratesfromthesameperiodintheprioryear.
NormalizedEBITDA,NormalizedEBITandUnderlyingProfitarenotaccountingmeasuresunderIFRSandshouldnotbeconsideredasanalternativetoprofitattributabletoequityholdersasameasureofoperationalperformance,oranalternativetocashflowasameasureofliquidity.UnderlyingEPSandconstantcurrencyUnderlyingEPSarenotaccountingmeasuresunderIFRSandshouldnotbeconsideredasalternativestoearningspershareasameasureofoperatingperformanceonapersharebasis.Thesenon-IFRSfinancialmeasuresdonothaveastandardcalculationmethodandABInBev’sdefinitionofNormalizedEBITDA,NormalizedEBIT,UnderlyingProfit,UnderlyingEPSandconstantcurrencyUnderlyingEPSmaynotbecomparabletothatofothercompanies.
CashFlowsandFinancialPosition
Figure13.CashFlowStatement(millionUSD)
HY24
HY25
Operatingactivities
Profitoftheperiod
3236
4568
Interest,taxesandnon-cashitemsincludedinprofit
7588
5736
Cashflowfromoperatingactivitiesbeforechangesinworkingcapitalanduseofprovisions
10824
10304
Changeinworkingcapital
(4170
)
(3655
)
Pensioncontributionsanduseofprovisions
(251
)
(278
)
Interestandtaxes(paid)/received
(3958
)
(3801
)
Dividendsreceived
123
135
Cashflowfrom/(usedin)operatingactivities
2568
2704
Investingactivities
Netcapex
(1684
)
(1350
)
Sale/(acquisition)ofsubsidiaries,netofcash
(19
)
(4
)
Netproceedsfromsale/(acquisition)ofotherassets
(29
)
47
Cashflowfrom/(usedin)investingactivities
(1732
)
(1306
)
Financingactivities
Net(repaymentsof)/proceedsfromborrowings
1124
68
Dividendspaid
(2142
)
(3147
)
Sharebuyback
(838
)
(1901
)
Paymentofleaseliabilities
(406
)
(354
)
Derivativefinancialinstruments
(172
)
114
Sale/(acquisition)ofnon-controllinginterests
(414
)
(314
)
Otherfinancingcashflows
(465
)
(303
)
Cashflowfrom/(usedin)financingactivities
(3313
)
(5837
)
Netincrease/(decrease)incashandcashequivalents
(2476
)
(4438
)
Ourfreecashflow(definedascashflowfromoperatingactivitieslessnetcapex)increasedby470millionUSDtoreach1355millionUSDinHY25.Ourcashandcashequivalentsdecreasedby4438millionUSDinHY25,comparedtoadecreaseof2476millionUSDinHY24,withthefollowingmovements:
Ourcashflowfromoperatingactivitiesreached2704millionUSDinHY25comparedto2568millionUSDinHY24.TheincreasewasdrivenbychangesinworkingcapitalforHY25comparedtoHY24.Changesinworkingcapitalinthefirsthalfof2025and2024reflecthigherworkingcapitallevelsattheendofJunethanatyear-endasaresultofseasonality.
Ourcashoutflowfrominvestingactivitieswas1306millionUSDinHY25comparedtoacashoutflowof1732millionUSDinHY24.ThedecreaseinthecashoutflowwasmainlyduetolowernetcapitalexpendituresinHY25comparedtoHY24.OutofthetotalHY25capitalexpenditures,approximately34%wasusedtoimprovethecompany’sproductionfacilitieswhile51%wasusedforlogisticsandcommercialinvestmentsand15%wasusedforthepurchaseofhardwareandsoftwareandimprovingadministrativecapabilities.
Ourcashoutflowfromfinancingactivitiesamountedto5837millionUSDinHY25,ascomparedtoacashoutflowof3313millionUSDinHY24.TheincreaseinthecashoutflowversusHY24wasprimarilydrivenbythecompletionofour2billionUSDsharebuybackprogram,higherdividendspaidandlowerdebtissuancein2025comparedto2024.
Ournetdebtincreasedto68.1billionUSDasof30June2025from60.6billionUSDasof31December2024.OurnetdebttonormalizedEBITDAratiowas3.27xasof30June2025.OuroptimalcapitalstructureisanetdebttonormalizedEBITDAratioofaround2x.
Wecontinuetoproactivelymanageourdebtportfolio.Afterbondrepurchasesof3billionUSDandissuancesof3billionEuroinHY25,98%ofourbondportfolioholdsafixed-interestrate,50%isdenominatedincurrenciesotherthanUSDandmaturitiesarewell-distributedacrossthenextseveralyears.
Asof30June2025,wehadtotalliquidityof17.5billionUSD,whichconsistedof10.1billionUSDavailableundercommittedlong-termcreditfacilitiesand7.4billionUSDofcash,cashequivalentsandshort-terminvestmentsindebtsecuritieslessbankoverdrafts.
Notes
TofacilitatetheunderstandingofABInBev’sunderlyingperformance,theanalysesofgrowth,includingallcommentsinthispressrelease,unlessotherwiseindicated,arebasedonorganicgrowthandnormalizednumbers.Inotherwords,financialsareanalyzedeliminatingtheimpactofchangesincurrenciesontranslationofforeignoperations,andscopechanges.Since1Q24,thedefinitionoforganicrevenuegrowthhasbeenamendedtocapthepricegrowthinArgentinatoamaximumof2%permonth(26.8%year-over-year).Correspondingadjustmentsaremadetoallincomestatementrelateditemsintheorganicgrowthcalculationsthroughscopechanges.Scopechangesalsorepresenttheimpactofacquisitionsanddivestitures,thestartorterminationofactivitiesorthetransferofactivitiesbetweensegments,curtailmentgainsandlossesandyearoveryearchangesinaccountingestimatesandotherassumptionsthatmanagementdoesnotconsideraspartoftheunderlyingperformanceofthebusiness.Theorganicgrowthofourglobalbrands,Budweiser,StellaArtois,andCoronaexcludesexportstoAustraliaforwhichaperpetuallicensewasgrantedtoathirdpartyupondisposaloftheAustraliaoperationsin2020.Allreferencesperhectoliter(perhl)excludeUSnon-beverageactivities.Wheneverpresentedinthisdocument,allperformancemeasures(EBITDA,EBIT,profit,taxrate,EPS)arepresentedona“normalized”basis,whichmeanstheyarepresentedbeforenon-underlyingitems.Non-underlyingitemsareeitherincomeorexpenseswhichdonotoccurregularlyaspartofthenormalactivitiesoftheCompany.TheyarepresentedseparatelybecausetheyareimportantfortheunderstandingoftheunderlyingsustainableperformanceoftheCompanyduetotheirsizeornature.NormalizedmeasuresareadditionalmeasuresusedbymanagementandshouldnotreplacethemeasuresdeterminedinaccordancewithIFRSasanindicatoroftheCompany’sperformance.WearereportingtheresultsfromArgentinaapplyinghyperinflationaccountingsince3Q18.TheIFRSrules(IAS29)requireustorestatetheyear-to-dateresultsforthechangeinthegeneralpurchasingpowerofthelocalcurrency,usingofficialindicesbeforeconvertingthelocalamountsattheclosingrateoftheperiod.In2Q25,wereportedanegativeimpactfromhyperinflationaccountingontheprofitattributabletoequityholdersofABInBevof(14)millionUSD.Theimpactin2Q25BasicEPSwas(0.01)USD.Valuesinthefiguresandannexesmaynotaddup,duetorounding.2Q25andHY25EPSisbaseduponaweightedaverageof1989millionsharescomparedtoaweightedaverageof2005millionsharesfor2Q24andHY24.
Legaldisclaimer
Thisreleasecontains“forward-lookingstatements”.ThesestatementsarebasedonthecurrentexpectationsandviewsoffutureeventsanddevelopmentsofthemanagementofABInBevandarenaturallysubjecttouncertaintyandchangesincircumstances.Theforward-lookingstatementscontainedinthisreleaseincludestatementsotherthanhistoricalfactsandincludestatementstypicallycontainingwordssuchas“will”,“may”,“should”,“believe”,“intends”,“expects”,“anticipates”,“targets”,“ambition”,“estimates”,“likely”,“foresees”andwordsofsimilarimport.Allstatementsotherthanstatementsofhistoricalfactsareforward-lookingstatements.Youshouldnotplaceunduerelianceontheseforward-lookingstatements,whichreflectthecurrentviewsofthemanagementofABInBev,aresubjecttonumerousrisksanduncertaintiesaboutABInBevandaredependentonmanyfactors,someofwhichareoutsideofABInBev’scontrol.Thereareimportantfactors,risksanduncertaintiesthatcouldcauseactualoutcomesandresultstobemateriallydifferent,including,butnotlimitedtotherisksanduncertaintiesrelatingtoABInBevthataredescribedunderItem3.DofABInBev’sAnnualReportonForm20-FfiledwiththeSECon12March2025.Manyoftheserisksanduncertaintiesare,andwillbe,exacerbatedbyanyfurtherworseningoftheglobalbusinessandeconomicenvironment,includingasaresultofforeigncurrencyexchangeratefluctuationsandongoinggeopoliticalconflicts.Otherunknownorunpredictablefactorscouldcauseactualresultstodiffermateriallyfromthoseintheforward-lookingstatements.Theforward-lookingstatementsshouldbereadinconjunctionwiththeothercautionarystatementsthatareincludedelsewhere,includingABInBev’smostrecentForm20-FandotherreportsfurnishedonForm6-K,andanyotherdocumentsthatABInBevhasmadepublic.Anyforward-lookingstatementsmadeinthiscommunicationarequalifiedintheirentiretybythesecautionarystatementsandtherecanbenoassurancethattheactualresultsordevelopmentsanticipatedbyABInBevwillberealizedor,evenifsubstantiallyrealized,thattheywillhavetheexpectedconsequencesto,oreffectson,ABInBevoritsbusinessoroperations.Exceptasrequiredbylaw,ABInBevundertakesnoobligationtopubliclyupdateorreviseanyforward-lookingstatements,whetherasaresultofnewinformation,futureeventsorotherwise.Thehalfyear2025(HY25)financialdatasetoutinFigure1(exceptforthevolumeinformation),Figures3to6,8,10,12and13ofthispressreleasehavebeenextractedfromthegroup’sunauditedcondensedconsolidatedinterimfinancialstatementsasofandforthesixmonthsended30June2025,whichhavebeenreviewedbyourstatutoryauditorsPwCBedrijfsrevisorenBV/Réviseursd’EntreprisesSRLinaccordancewiththestandardsofthePublicCompanyAccountingOversightBoard(UnitedStates).Thesecondquarter2025(2Q25)financialdatasetoutinFigure1(exceptforthevolumeinformation),Figures3to6,8,10,12and13,andthefinancialdataincludedinFigures7,9,11and14ofthispressreleasehavebeenextractedfromtheunderlyingaccountingrecordsasofandforthesixmonthsended30June2025.Referencesinthisdocumenttomaterialsonourwebsites,suchaswww.ab-inbev.com,areincludedasanaidtotheirlocationandarenotincorporatedbyreferenceintothisdocument.
Conferencecallandwebcast
InvestorConferencecallandwebcastonThursday,31July2025:
3.00pmBrussels/2.00pmLondon/9.00amNewYork
Registrationdetails:
Webcast(listen-onlymode):
ABInBev2Q25ResultsWebcast
Tojoinbyphone,pleaseuseoneofthefollowingtwophonenumbers:
Toll-Free:+1-877-407-8029
Toll:+1-201-689-8029
AboutABInBev
Anheuser-BuschInBev(ABInBev)isapubliclytradedcompany(Euronext:ABI)basedinLeuven,Belgium,withsecondarylistingsontheMexico(MEXBOL:ANB)andSouthAfrica(JSE:ANH)stockexchangesandwithAmericanDepositaryReceiptsontheNewYorkStockExchange(NYSE:BUD).Asacompany,wedreambigtocreateafuturewithmorecheers.Wearealwayslookingtoserveupnewwaystomeetlife’smoments,moveourindustryforwardandmakeameaningfulimpactintheworld.Wearecommittedtobuildinggreatbrandsthatstandthetestoftimeandtobrewingthebestbeersusingthefinestingredients.Ourdiverseportfolioofwellover500beerbrandsincludesglobalbrandsBudweiser®,Corona®,StellaArtois®andMichelobUltra®;multi-countrybrandsBeck’s®,Hoegaarden®andLeffe®;andlocalchampionssuchasAguila®,Antarctica®,BudLight®,Brahma®,Cass®,Castle®,CastleLite®,Cristal®,Harbin®,Jupiler®,ModeloEspecial®,Quilmes®,Victoria®,Sedrin®,andSkol®.Ourbrewingheritagedatesbackmorethan600years,spanningcontinentsandgenerations.FromourEuropeanrootsattheDenHoornbreweryinLeuven,Belgium.TothepioneeringspiritoftheAnheuser&CobreweryinSt.Louis,US.TothecreationoftheCastleBreweryinSouthAfricaduringtheJohannesburggoldrush.ToBohemia,thefirstbreweryinBrazil.Geographicallydiversifiedwithabalancedexposuretodevelopedanddevelopingmarkets,weleveragethecollectivestrengthsofapproximately144000colleaguesbasedinnearly50countriesworldwide.For2024,ABInBev’sreportedrevenuewas59.8billionUSD(excludingJVsandassociates).
Annex1:Segmentreporting(2Q)
ABInBevWorldwide
2Q24
Scope
Currency
Translation
Organic
Growth
2Q25
Organic
Growth
Volumes
146302
(224
)
-
(2730
)
143347
(1.9
)%
Revenue
15333
(100
)
(688
)
458
15004
3.0
%
Costofsales
(6766
)
25
298
(115
)
(6558
)
(1.7
)%
Grossprofit
8567
(75
)
(389
)
343
8446
4.0
%
SG&A
(4813
)
1
186
2
(4624
)
0.0
%
Otheroperatingincome/(expenses)
151
(0
)
(11
)
52
191
35.2
%
NormalizedEBIT
3905
(74
)
(215
)
397
4013
10.2
%
NormalizedEBITDA
5302
(74
)
(268
)
341
5301
6.5
%
NormalizedEBITDAmargin
34.6
%
35.3
%
116bps
NorthAmerica
2Q24
Scope
Currency
Translation
Organic
Growth
2Q25
Organic
Growth
Volumes
22639
(330
)
-
68
22376
0.3
%
Revenue
3864
(89
)
(13
)
82
3844
2.2
%
Costofsales
(1606
)
71
4
(6
)
(1537
)
(0.4
)%
Grossprofit
2258
(18
)
(8
)
76
2307
3.4
%
SG&A
(1101
)
(2
)
3
(23
)
(1122
)
(2.0
)%
Otheroperatingincome/(expenses)
4
-
0
5
10
-
NormalizedEBIT
1161
(21
)
(5
)
59
1195
5.1
%
NormalizedEBITDA
1338
(21
)
(5
)
60
1372
4.5
%
NormalizedEBITDAmargin
34.6
%
35.7
%
81bps
MiddleAmericas
2Q24
Scope
Currency
Translation
Organic
Growth
2Q25
Organic
Growth
Volumes
38381
-
-
441
38822
1.1
%
Revenue
4522
(13
)
(400
)
230
4340
5.1
%
Costofsales
(1593
)
(16
)
135
(43
)
(1516
)
(2.7
)%
Grossprofit
2929
(29
)
(265
)
188
2824
6.4
%
SG&A
(1100
)
10
91
11
(987
)
1.0
%
Otheroperatingincome/(expenses)
11
-
(0
)
(8
)
3
(73.2
)%
NormalizedEBIT
1841
(18
)
(174
)
190
1839
10.4
%
NormalizedEBITDA
2219
(18
)
(203
)
152
2149
6.9
%
NormalizedEBITDAmargin
49.1
%
49.5
%
83bps
SouthAmerica
2Q24
Scope
Currency
Translation
Organic
Growth
2Q25
Organic
Growth
Volumes
35969
-
-
(1770
)
34199
(4.9
)%
Revenue
2785
(32
)
(323
)
99
2529
3.6
%
Costofsales
(1427
)
(10
)
180
(57
)
(1314
)
(4.0
)%
Grossprofit
1358
(42
)
(143
)
42
1215
3.1
%
SG&A
(976
)
7
119
(13
)
(863
)
(1.4
)%
Otheroperatingincome/(expenses)
99
(6
)
(12
)
22
104
24.7
%
NormalizedEBIT
482
(41
)
(36
)
51
456
10.9
%
NormalizedEBITDA
750
(41
)
(70
)
53
692
7.2
%
NormalizedEBITDAmargin
26.9
%
27.4
%
93bps
EMEA
2Q24
Scope
Currency
Translation
Organic
Growth
2Q25
Organic
Growth
Volumes
23852
112
-
208
24172
0.9
%
Revenue
2301
9
60
118
2489
5.2
%
Costofsales
(1179
)
2
(31
)
(44
)
(1252
)
(3.8
)%
Grossprofit
1122
12
29
74
1237
6.7
%
SG&A
(691
)
(21
)
(24
)
(27
)
(764
)
(3.8
)%
Otheroperatingincome/(expenses)
34
5
2
15
56
37.4
%
NormalizedEBIT
465
(4
)
6
63
529
13.7
%
NormalizedEBITDA
721
(4
)
15
68
800
9.5
%
NormalizedEBITDAmargin
31.3
%
32.1
%
129bps
AsiaPacific
2Q24
Scope
Currency
Translation
Organic
Growth
2Q25
Organic
Growth
Volumes
25399
-
-
(1683
)
23716
(6.6
)%
Revenue
1749
0
(13
)
(78
)
1658
(4.5
)%
Costofsales
(821
)
(7
)
6
50
(771
)
6.1
%
Grossprofit
928
(7
)
(7
)
(28
)
886
(3.0
)%
SG&A
(549
)
1
5
24
(520
)
4.3
%
Otheroperatingincome/(expenses)
30
0
-
(14
)
17
(45.1
)%
NormalizedEBIT
410
(7
)
(3
)
(18
)
383
(4.4
)%
NormalizedEBITDA
570
(6
)
(3
)
(27
)
533
(4.8
)%
NormalizedEBITDAmargin
32.6
%
32.2
%
(9)bps
GlobalExportandHoldingCompanies
2Q24
Scope
Currency
Translation
Organic
Growth
2Q25
Organic
Growth
Volumes
62
(6
)
-
6
62
10.4
%
Revenue
112
25
1
6
144
7.2
%
Costofsales
(141
)
(15
)
5
(15
)
(168
)
(12.5
)%
Grossprofit
(30
)
10
5
(9
)
(23
)
(26.6
)%
SG&A
(396
)
6
(7
)
30
(368
)
7.8
%
Otheroperatingincome/(expenses)
(28
)
0
(2
)
31
2
-
NormalizedEBIT
(453
)
17
(4
)
52
(389
)
11.7
%
NormalizedEBITDA
(295
)
17
(1
)
35
(245
)
12.2
%
Annex2:Segmentreporting(HY)
ABInBevWorldwide
HY24
Scope
Currency
Translation
Organic
Growth
HY25
Organic
Growth
Volumes
285837
(498
)
-
(5724
)
279615
(2.0
)%
Revenue
29880
(131
)
(1786
)
669
28632
2.3
%
Costofsales
(13419
)
(39
)
770
87
(12602
)
0.7
%
Grossprofit
16461
(170
)
(1016
)
755
16029
4.6
%
SG&A
(9248
)
(19
)
510
(55
)
(8812
)
(0.6
)%
Otheroperatingincome/(expenses)
334
13
(33
)
69
383
20.8
%
NormalizedEBIT
7547
(176
)
(539
)
769
7601
10.3
%
NormalizedEBITDA
10288
(174
)
(691
)
733
10156
7.2
%
NormalizedEBITDAmargin
34.4
%
35.5
%
166bps
NorthAmerica
HY24
Scope
Currency
Translation
Organic
Growth
HY25
Organic
Growth
Volumes
43992
(474
)
-
(1299
)
42218
(3.0
)%
Revenue
7457
(126
)
(38
)
(85
)
7208
(1.2
)%
Costofsales
(3150
)
91
13
100
(2947
)
3.3
%
Grossprofit
4307
(35
)
(25
)
14
4261
0.3
%
SG&A
(2186
)
(8
)
14
7
(2174
)
0.3
%
Otheroperatingincome/(expenses)
(8
)
-
1
31
23
-
NormalizedEBIT
2112
(43
)
(10
)
51
2110
2.5
%
NormalizedEBITDA
2464
(43
)
(12
)
50
2459
2.0
%
NormalizedEBITDAmargin
33.0
%
34.1
%
108bps
MiddleAmericas
HY24
Scope
Currency
Translation
Organic
Growth
HY25
Organic
Growth
Volumes
74072
-
-
(169
)
73903
(0.2
)%
Revenue
8574
(25
)
(799
)
374
8124
4.4
%
Costofsales
(3179
)
(30
)
273
70
(2866
)
2.2
%
Grossprofit
5395
(55
)
(526
)
444
5258
8.3
%
SG&A
(2065
)
16
192
(42
)
(1898
)
(2.1
)%
Otheroperatingincome/(expenses)
23
-
(2
)
(7
)
14
(31.2
)%
NormalizedEBIT
3353
(38
)
(336
)
395
3374
11.9
%
NormalizedEBITDA
4105
(38
)
(404
)
344
4007
8.4
%
NormalizedEBITDAmargin
47.9
%
49.3
%
186bps
SouthAmerica
HY24
Scope
Currency
Translation
Organic
Growth
HY25
Organic
Growth
Volumes
76315
-
-
(1226
)
75089
(1.6
)%
Revenue
6018
13
(900
)
375
5507
6.2
%
Costofsales
(3013
)
(99
)
461
(113
)
(2764
)
(3.7
)%
Grossprofit
3005
(86
)
(438
)
262
2743
8.7
%
SG&A
(1917
)
(26
)
287
(57
)
(1712
)
(2.9
)%
Otheroperatingincome/(expenses)
215
3
(30
)
14
201
6.9
%
NormalizedEBIT
1304
(109
)
(181
)
219
1233
17.2
%
NormalizedEBITDA
1834
(106
)
(262
)
233
1699
12.9
%
NormalizedEBITDAmargin
30.5
%
30.9
%
188bps
EMEA
HY24
Scope
Currency
Translation
Organic
Growth
HY25
Organic
Growth
Volumes
44882
77
-
(35
)
44924
(0.1
)%
Revenue
4228
1
16
209
4454
5.0
%
Costofsales
(2215
)
13
(5
)
(72
)
(2280
)
(3.3
)%
Grossprofit
2014
14
11
136
2174
6.8
%
SG&A
(1305
)
(37
)
(9
)
(20
)
(1371
)
(1.5
)%
Otheroperatingincome/(expenses)
79
11
0
11
101
12.5
%
NormalizedEBIT
787
(13
)
2
128
904
16.5
%
NormalizedEBITDA
1290
(13
)
5
142
1424
11.1
%
NormalizedEBITDAmargin
30.5
%
32.0
%
177bps
AsiaPacific
HY24
Scope
Currency
Translation
Organic
Growth
HY25
Organic
Growth
Volumes
46444
(93
)
-
(2987
)
43365
(6.4
)%
Revenue
3383
(7
)
(65
)
(203
)
3108
(6.0
)%
Costofsales
(1583
)
(9
)
29
108
(1456
)
6.8
%
Grossprofit
1800
(16
)
(37
)
(95
)
1652
(5.3
)%
SG&A
(994
)
(2
)
21
35
(941
)
3.5
%
Otheroperatingincome/(expenses)
56
0
(0
)
(15
)
41
(26.7
)%
NormalizedEBIT
861
(18
)
(16
)
(75
)
752
(8.8
)%
NormalizedEBITDA
1186
(18
)
(21
)
(90
)
1056
(7.7
)%
NormalizedEBITDAmargin
35.0
%
34.0
%
(62)bps
GlobalExportandHoldingCompanies
HY24
Scope
Currency
Translation
Organic
Growth
HY25
Organic
Growth
Volumes
132
(9
)
-
(7
)
116
(5.7
)%
Revenue
221
12
0
(2
)
231
(0.8
)%
Costofsales
(279
)
(5
)
(1
)
(5
)
(290
)
(2.1
)%
Grossprofit
(59
)
7
(1
)
(7
)
(59
)
(10.1
)%
SG&A
(781
)
38
5
22
(716
)
3.0
%
Otheroperatingincome/(expenses)
(31
)
0
(2
)
35
2
-
NormalizedEBIT
(870
)
45
2
51
(773
)
6.1
%
NormalizedEBITDA
(590
)
45
2
54
(489
)
9.9
%
Annex3:Consolidatedstatementoffinancialposition
MillionUSdollar
31December2024
30June2025
ASSETS
Non-currentassets
Property,plantandequipment
23503
23854
Goodwill
110479
114782
Intangibleassets
40034
41096
Investmentsinassociates
4612
4878
Investmentsecurities
168
152
Deferredtaxassets
2493
2730
Pensionsandsimilarobligations
42
101
Incometaxreceivables
470
426
Derivatives
261
44
Tradeandotherreceivables
1577
1829
Totalnon-currentassets
183637
189892
Currentassets
Investmentsecurities
221
205
Inventories
5020
5475
Incometaxreceivables
727
872
Derivatives
554
340
Tradeandotherreceivables
5270
6994
Cashandcashequivalents
11174
7167
Assetsclassifiedasheldforsale
33
161
Totalcurrentassets
22999
21215
Totalassets
206637
211107
EQUITYANDLIABILITIES
Equity
Issuedcapital
1736
1736
Sharepremium
17620
17620
Reserves
12304
13674
Retainedearnings
46577
47641
EquityattributabletoequityholdersofABInBev
78237
80671
Non-controllinginterests
10463
10743
Totalequity
88700
91414
Non-currentliabilities
Interest-bearingloansandborrowings
70720
71979
Pensionsandsimilarobligations
1296
1287
Deferredtaxliabilities
11321
11385
Incometaxpayables
284
296
Derivatives
68
372
Tradeandotherpayables
797
1013
Provisions
385
352
Totalnon-currentliabilities
84871
86683
Currentliabilities
Bankoverdrafts
-
21
Interest-bearingloansandborrowings
1449
3578
Incometaxpayables
1805
1386
Derivatives
5817
5609
Tradeandotherpayables
23804
22188
Provisions
191
202
Liabilitiesassociatedwithassetsheldforsale
-
25
Totalcurrentliabilities
33066
33009
Totalequityandliabilities
206637
211107
Annex4:Consolidatedstatementofcashflows
Forthesix-monthperiodended30June
MillionUSdollar
2024
2025
OPERATINGACTIVITIES
Profitoftheperiod
3236
4568
Depreciation,amortizationandimpairment
2741
2581
Netfinanceexpense/(income)
2887
1678
Equity-settledshare-basedpaymentexpense
315
309
Incometaxexpense
1546
1404
Shareofresultsofassociates
(241
)
(144
)
Othernon-cashitems
339
(93
)
Cashflowfromoperatingactivitiesbeforechangesinworkingcapitalanduseofprovisions
10824
10304
Decrease/(increase)intradeandotherreceivables
(1154
)
(1130
)
Decrease/(increase)ininventories
(325
)
(242
)
Increase/(decrease)intradeandotherpayables
(2691
)
(2284
)
Pensioncontributionsanduseofprovisions
(251
)
(278
)
Cashgeneratedfromoperations
6403
6370
Interestpaid
(2001
)
(1916
)
Interestreceived
303
241
Dividendsreceived
123
135
Incometaxpaid
(2260
)
(2126
)
Cashflowfrom/(usedin)operatingactivities
2568
2704
INVESTINGACTIVITIES
Acquisitionofproperty,plantandequipmentandofintangibleassets
(1735
)
(1404
)
Proceedsfromsaleofproperty,plantandequipmentandofintangibleassets
52
55
Sale/(acquisition)ofsubsidiaries,netofcash
(19
)
(4
)
Proceedsfromsale/(acquisition)ofotherassets
(29
)
47
Cashflowfrom/(usedin)investingactivities
(1732
)
(1306
)
FINANCINGACTIVITIES
Proceedsfromborrowings
5466
4067
Repaymentsofborrowings
(4342
)
(3998
)
Dividendspaid
(2142
)
(3147
)
Sharebuyback
(838
)
(1901
)
Paymentofleaseliabilities
(406
)
(354
)
Derivativefinancialinstruments
(172
)
114
Sale/(acquisition)ofnon-controllinginterests
(414
)
(314
)
Otherfinancingcashflows
(465
)
(303
)
Cashflowfrom/(usedin)financingactivities
(3313
)
(5837
)
Netincrease/(decrease)incashandcashequivalents
(2476
)
(4438
)
Cashandcashequivalentslessbankoverdraftsatbeginningofyear
10314
11174
Effectofexchangeratefluctuations
(463
)
410
Cashandcashequivalentslessbankoverdraftsatendofperiod
7375
7146
本文链接:http://www.iruis.com/News/cninfo/73132.shtml


热门资讯

传吉利亿咖通高级副总裁即将离职
佚名
点击:136

花旗IT部门在国内裁员3500人,赔偿最高N+6
佚名
点击:136
新潮传媒张继学:公司以83亿价格卖了,但自己还要…
佚名
点击:123

深圳星灿完成千万级天使轮融资 主攻割草机器人领域
佚名
点击:120

百度推出首个短剧APP:好看免费短剧
佚名
点击:118

罗马仕深夜发停工放假通知,员工称无协商
佚名
点击:117
艾为电气创业板IPO获受理:年入4.4亿,小米蔚来是…
佚名
点击:117
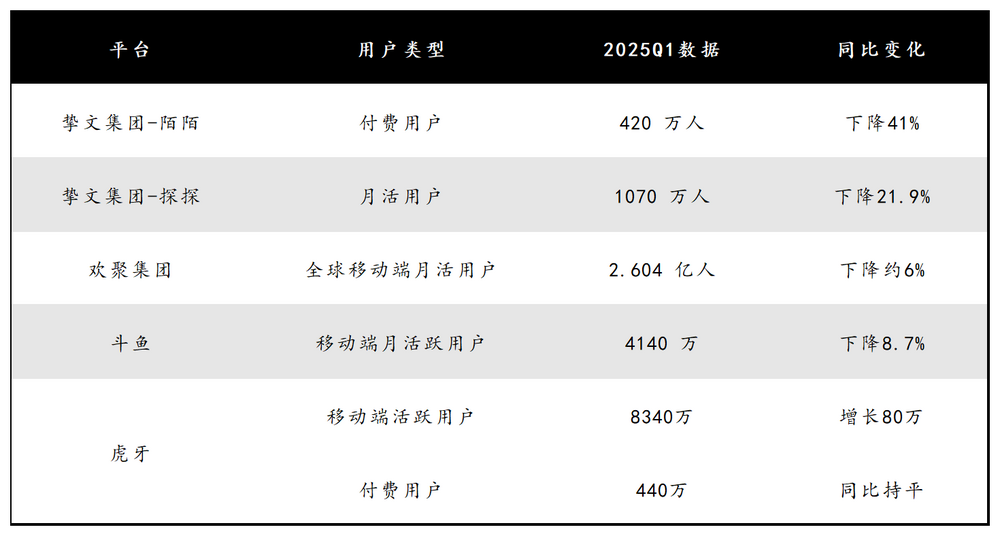
用户流失、出海不易,短剧能救映宇宙?
佚名
点击:115

奇瑞成立国内事业群,整合旗下四大事业部
佚名
点击:113

我国三大运营商重启 eSIM 业务,消息称暂不涉足手…
佚名
点击:112