AB InBev Reports Second Quarter 2023 Results
Continued global momentum, partially offset by US performance, delivered high-single digit revenue growth
BRUSSELS--(BUSINESS WIRE)--AB InBev (Brussel:ABI) (BMV:ANB) (JSE:ANH) (NYSE:BUD):
Regulated information1
“Our business delivered another quarter of profitable growth. Revenue increased by 7.2% with an EBITDA increase of 5.0%. We continue to invest in our strategic priorities for the long-term.” – Michel Doukeris, CEO, AB InBev
Total Revenue
+7.2%
Revenue increased by 7.2% in 2Q23 with revenue per hl growth of 9.0% and by 10.0% in HY23 with revenue per hl growth of 10.6%.
18.4% increase in combined revenues of our global brands, Budweiser, Stella Artois and Corona, outside of their respective home markets in 2Q23, and 16.9% in HY23.
Approximately 64% of our revenue through B2B digital platforms with the monthly active user base of BEES reaching 3.3 million users.
Over 115 million USD of revenue generated by our digital direct-to-consumer ecosystem.
Total Volume
-1.4%
In 2Q23, total volumes declined by 1.4%, with own beer volumes down by 1.8% and non-beer volumes up by 0.5%. In HY23, total volumes declined by 0.3% with own beer volumes down by 0.8% and non-beer volumes up by 2.1%.
Normalized EBITDA
+5.0%
In 2Q23, normalized EBITDA increased by 5.0% to 4 909 million USD with a normalized EBITDA margin contraction of 69 bps to 32.5%. In HY23, normalized EBITDA increased by 9.1% to 9 668 million USD and normalized EBITDA margin contracted by 29 bps to 33.0%. Normalized EBITDA figures of HY22 include an impact of 201 million USD from tax credits in Brazil. Underlying Profit
1 452 million USD
Underlying profit (profit attributable to equity holders of AB InBev excluding non-underlying items and the impact of hyperinflation) was 1 452 million USD in 2Q23 compared to 1 468 million USD in 2Q22 and was 2 762 million USD in HY23 compared to 2 672 million USD in HY22.
Underlying EPS
0.72 USD
Underlying EPS was 0.72 USD in 2Q23, a decrease from 0.73 USD in 2Q22 and was 1.37 USD in HY23, an increase from 1.33 USD in HY22.
Net Debt to EBITDA
3.70x
Net debt to normalized EBITDA ratio was 3.70x at 30 June 2023 compared to 3.86x at 30 June 2022 and 3.51x at 31 December 2022.
The 2023 Half Year Financial Report is available on our website at www.ab-inbev.com.
1The enclosed information constitutes regulated information as defined in the Belgian Royal Decree of 14 November 2007 regarding the duties of issuers of financial instruments which have been admitted for trading on a regulated market. For important disclaimers and notes on the basis of preparation, please refer to page 15.
Management comments
Continued global momentum, partially offset by US performance, delivered high-single digit revenue growth
We delivered a top-line increase of 7.2%, with revenue growth in more than 85% of our markets, driven by a revenue per hl increase of 9.0% as a result of pricing actions, ongoing premiumization and other revenue management initiatives. Volumes declined by 1.4%, as growth in the majority of our markets was offset by performance in the US. EBITDA increased by 5.0% with margin compression of 69bps, driven by anticipated commodity cost headwinds and increased sales and marketing investments. Underlying EPS was 0.72 USD.
Progressing our strategic priorities
We continue to execute on and invest in three key strategic pillars to deliver consistent growth and long-term value creation.
Lead and grow the category:
This quarter we delivered volume growth in the majority of our markets and revenue growth in more than 85%.
Digitize and monetize our ecosystem:
BEES captured approximately 9.2 billion USD of gross merchandise value (GMV), a 30% increase versus 2Q22 with 64% of our revenue through B2B digital channels. BEES Marketplace is live in 15 markets and generated an annualized GMV of approximately 1.3 billion USD with 63% of BEES customers now also Marketplace buyers.
Optimize our business:
In HY23, disciplined overhead management and efficient resource allocation enabled us to invest approximately 2.1 billion USD in capex and 3.5 billion USD in sales and marketing to drive the organic growth of our business. We continue to focus on deleveraging with net debt to EBITDA reaching 3.70x versus 3.86x as of 30 June 2022.
Lead and grow the category
In HY23, we invested approximately 3.5 billion USD in sales and marketing, a 12.8% increase versus HY22, driving an increase of our portfolio brand power in approximately 60% of our key markets. We are executing on our five proven and scalable levers to drive category expansion:
Inclusive Category: In 2Q23, the percentage of consumers purchasing our portfolio of brands increased across key markets in Latin America and Africa, according to our estimates. This increase in participation was led by female and lower income consumer groups, driven by continued brand and pack innovation.
Core Superiority: In 2Q23, our mainstream portfolio delivered a mid-single digit revenue increase as double-digit growth in South Africa and Colombia was partially offset by the revenue decline of Bud Light in the US. Our mainstream brands gained or maintained share of segment in two thirds of our key markets, according to our estimates.
Occasions Development: Our global no-alcohol beer portfolio delivered approximately 30% revenue growth this quarter, with our performance driven by Budweiser Zero in Brazil and growth of Corona Cero in Canada and Europe. Leveraging our digital direct-to-consumer products we are investing in and developing new consumption occasions. For example, in Brazil, Zé Delivery enabled the launch of Corona Sunset Hours, an everyday activation encouraging consumers to disconnect from work and reconnect with friends in the early evening.
Premiumization: Our above core beer portfolio grew revenue by more than 10% in 2Q23, led by our global brands and double-digit growth of Modelo in Mexico and Spaten in Brazil. Our global brands grew revenue by 18.4% outside of their home markets, led by Corona, which was recently recognized by Kantar BrandZ as the #1 fastest growing global beer brand by value, which grew by 23.7%. Budweiser delivered a revenue increase of 16.9%, with broad-based growth in 25 markets, and Stella Artois grew by 14.5%.
Beyond Beer: Our global Beyond Beer business contributed over 385 million USD of revenue in the quarter and grew by mid-single digits as growth globally was partially offset by a soft malt-based seltzer industry in the US. Global growth was primarily driven by the expansion of Brutal Fruit in Africa and the Vicky portfolio in Mexico.
Digitize and monetize our ecosystem
Digitizing our relationships with more than 6 million customers globally: As of 30 June 2023, BEES is live in 23 markets with approximately 64% of our 2Q23 revenues captured through B2B digital platforms. In 2Q23, BEES had 3.3 million monthly active users and captured approximately 9.2 billion USD in gross merchandise value (GMV), growth of 15% and 30% versus 2Q22 respectively. BEES Marketplace is live in 15 markets with 63% of BEES customers also marketplace buyers. Marketplace captured approximately 340 million USD in GMV from sales of third-party products this quarter, growth of 41% versus 2Q22.
Leading the way in DTC solutions: Our omnichannel direct-to-consumer (DTC) ecosystem of digital and physical products generated revenue of more than 385 million USD in 2Q23. Our digital DTC products, Zé Delivery, TaDa and PerfectDraft are available in 20 markets, generated 16.5 million ecommerce orders and delivered over 115 million USD in revenue this quarter, representing 18% growth versus 2Q22.
Optimize our business
In HY23, disciplined overhead management and efficient allocation of resources across our operations enabled us to invest approximately 2.1 billion USD in capex and 3.5 billion USD in sales and marketing to drive the organic growth of our business, while managing the continued elevated cost environment. Our net debt to EBITDA ratio reached 3.70x versus 3.86x as of 30 June 2022, an increase versus 3.51x as of 31 December 2022 due to the seasonality of our cashflow generation. Underlying EPS was 0.72 USD, a decrease of 0.01 USD per share versus 2Q22, cycling a 0.04 USD per share net benefit from tax credits in Brazil year-over-year.
Advancing our sustainability priorities
We continued to innovate and make progress towards our 2025 Sustainability Goals through key local initiatives with the potential to scale globally. For Climate Action, we invested in a biomass processor in our Jupille brewery in Belgium to produce thermal energy from malt husks, which is expected to reduce our gas consumption by more than 15% and lower our carbon emissions. In Sustainable Agriculture, to strengthen local supply chains we provided technical and financial training to over 900 smallholder barley farmers in Uganda. In Water Stewardship, we installed new vacuum pump technology in breweries across several markets to reduce water usage in bottle fillers by approximately 50%. For Circular Packaging, our business in Brazil launched a nationwide returnable bottle campaign to help increase the use of returnable packaging by promoting affordability and sustainability.
Creating a future with more cheers
In HY23, we delivered 10.0% revenue growth and 9.1% EBITDA growth while continuing to invest for the long-term in our brands, facilities and digital transformation. We remain focused on brewing high quality beer, providing best-in-class service to our customers, generating value for our stakeholders and delivering on our purpose to create a future with more cheers.
2023 Outlook
(i) Overall Performance: We expect our EBITDA to grow in line with our medium-term outlook of between 4-8% and our revenue to grow ahead of EBITDA from a healthy combination of volume and price. The outlook for FY23 reflects our current assessment of inflation and other macroeconomic conditions.
(ii) Net Finance Costs: Net pension interest expenses and accretion expenses are expected to be in the range of 200 to 230 million USD per quarter, depending on currency and interest rate fluctuations. We expect the average gross debt coupon in FY23 to be approximately 4%.
(iii) Effective Tax Rates (ETR): We expect the normalized ETR in FY23 to be in the range of 27% to 29%. The ETR outlook does not consider the impact of potential future changes in legislation.
(iv) Net Capital Expenditure: We expect net capital expenditure of between 4.5 and 5.0 billion USD in FY23.
Figure 1. Consolidated performance (million USD)
2Q222Q23Organic
growth
Total Volumes (thousand hls)149 729147 583-1.4%
AB InBev own beer131 107128 750-1.8%
Non-beer volumes17 54417 6360.5%
Third party products1 0791 19712.9%
Revenue14 79315 1207.2%
Gross profit7 9978 1015.5%
Gross margin54.1%53.6%-86 bps
Normalized EBITDA5 0964 9095.0%
Normalized EBITDA margin34.5%32.5%-69 bps
Normalized EBIT3 8113 5692.2%
Normalized EBIT margin25.8%23.6%-114 bps
Profit attributable to equity holders of AB InBev1 597339
Underlying profit attributable to equity holders of AB InBev1 4681 452
Earnings per share (USD)0.790.17
Underlying earnings per share (USD)0.730.72
HY22HY23Organic
growth
Total Volumes (thousand hls)289 074288 131-0.3%
AB InBev own beer251 692249 810-0.8%
Non-beer volumes35 48836 2232.1%
Third party products1 8942 09812.5%
Revenue28 02729 33310.0%
Gross profit15 24315 7968.8%
Gross margin54.4%53.9%-60 bps
Normalized EBITDA9 5839 6689.1%
Normalized EBITDA margin34.2%33.0%-29 bps
Normalized EBIT7 1057 0728.3%
Normalized EBIT margin25.4%24.1%-39 bps
Profit attributable to equity holders of AB InBev1 6921 977
Underlying profit attributable to equity holders of AB InBev2 6722 762
Earnings per share (USD)0.840.98
Underlying earnings per share (USD)1.331.37
Figure 2. Volumes (thousand hls)
2Q22ScopeOrganic2Q23Organic growth
growth Total
VolumeOwn beer
volume
North America27 36135-3 85423 542-14.1%-14.5%
Middle Americas37 775-11837 8930.3%-1.0%
South America36 4217- 69135 737-1.9%-1.5%
EMEA22 83860-1422 884-0.1%-0.3%
Asia Pacific25 097-2 37827 4759.5%9.3%
Global Export and Holding Companies238-102-8451-62.3%-
AB InBev Worldwide149 729--2 147147 583-1.4%-1.8%
HY22ScopeOrganicHY23Organic growth
growth Total
VolumeOwn beer
volume
North America51 44851-4 10447 395-8.0%-8.2%
Middle Americas72 024-14172 1640.2%-0.8%
South America76 815-- 79176 023-1.0%-1.7%
EMEA42 962104- 22442 842-0.5%-0.9%
Asia Pacific45 385-4 20449 5899.3%9.1%
Global Export and Holding Companies440-155-168117-58.9%-
AB InBev Worldwide289 074-- 943288 131-0.3%-0.8%
Key Market Performances
United States: Revenue declined by 10.5% impacted by volume performance
Operating performance:
2Q23: Revenue declined by 10.5% with revenue per hl growing by 5.2% driven by revenue management initiatives. Sales-to-wholesalers (STWs) were down by 15.0%. Sales-to-retailers (STRs) declined by 14.0%, underperforming the industry, primarily due to the volume decline of Bud Light. EBITDA declined by 28.2%, with approximately two thirds of this decrease attributable to market share performance and the remainder from productivity loss, increased sales and marketing investments and support measures for our wholesaler partners.
HY23: Revenue declined by 3.6% with revenue per hl growth of 5.4%. Our STWs declined by 8.6% and STRs were down by 9.2%. EBITDA declined by 14.8%.
Commercial highlights: The beer industry continued to demonstrate resilience in 2Q23, delivering revenue growth of 2.3% while volumes declined by 2.5%, according to Circana. Our total beer industry share declined this quarter but has been stable since the last week of April through the end of June. Since April, we actively engaged with over 170 000 consumers across the country through a third-party research firm and the data shows that most consumers surveyed are favorable towards the Bud Light brand and approximately 80% are favorable or neutral. As part of our long-term plan, we increased investments in our key brands, invested in measures to support our wholesalers and continued key initiatives such as partnerships with NFL, NBA, Folds of Honor and Farm Rescue.
Mexico: Double-digit top- and bottom-line growth with continued market share gain
Operating performance:
2Q23: Revenue grew by low-teens with revenue per hl growth of low-teens driven by pricing actions and other revenue management initiatives. Volumes declined by low-single digits, outperforming the industry which was impacted by an earlier Easter. EBITDA grew by mid-teens with margin expansion of over 175bps.
HY23: Revenue grew by low-teens with revenue per hl growing by low-teens and volumes flat. EBITDA grew by mid-teens.
Commercial highlights: Our performance this quarter was driven by ongoing portfolio development and digital transformation. Our above core portfolio continued to outperform, growing revenue by mid-teens, led by the strong performance of Modelo, Michelob Ultra and Pacifico. We continued to progress our digital and physical DTC initiatives this quarter with our digital DTC platform, TaDa, now operating in over 60 major cities and fulfilling on average over 300 000 orders per month and the opening of a further 150 Modelorama stores.
Colombia: High-single digit top- and double-digit bottom-line growth
Operating performance:
2Q23: Revenue grew by high-single digits with high-single digit revenue per hl growth, driven by pricing actions and other revenue management initiatives. Volumes grew by low-single digits, continuing to gain share of total alcohol in an improving consumer environment. EBITDA grew by low-twenties, driven by top-line growth and supported by cycling a loss from the disposal of non-core assets in 2Q22.
HY23: Revenue grew by high-single digits with revenue per hl growth of high-single digits. Volumes declined by low-single digits. EBITDA grew by high-single digits.
Commercial highlights: Our leading mainstream portfolio drove our performance this quarter, with a particularly strong performance from Poker which grew volumes by mid-teens.
Brazil: High-single digit top-line and double-digit bottom-line growth with margin expansion
Operating performance:
2Q23: Revenue grew by 9.4% with revenue per hl growth of 12.2% driven by revenue management initiatives and continued premiumization. Beer volumes declined by 2.6%, underperforming the industry according to our estimates, as we cycled a strong performance in 2Q22 which was supported by post-COVID recovery. Non-beer volumes declined by 2.2% resulting in a total volume decrease of 2.5%. EBITDA increased by 29.0% with margin expansion of approximately 400bps.
HY23: Total volumes were flat with beer volumes down 0.9% and non-beer volumes up 2.5%. Both revenue and revenue per hl increased by 12.4%. EBITDA grew by 27.7%.
Commercial highlights: Our premium and super premium brands continued to outperform this quarter, delivering volume growth in the mid-thirties, led by Original, Spaten and Corona. BEES Marketplace continued to expand, reaching over 700 thousand customers, a 29% increase versus 2Q22, and growing GMV by 64%. Our digital DTC platform, Zé Delivery, reached 4.6 million monthly active users this quarter, a 12% increase versus 2Q22, and increased GMV by 12%.
Europe: High single digit top- and bottom-line growth
Operating performance:
2Q23: Revenue grew by high-single digits with mid-teens revenue per hl growth, driven by pricing actions and the continued momentum of our premium and super premium brands. Volumes declined by mid-single digits, outperforming a soft industry in the majority of our key markets according to our estimates. EBITDA grew by high-single digits.
HY23: Revenue grew by double-digits, driven by mid-teens revenue per hl growth. Volumes declined by low-single digits. EBITDA increased by high-single digits.
Commercial highlights: We continue to drive premiumization across Europe. Our premium and super premium brands delivered double-digit revenue growth this quarter, led by Corona and Budweiser.
South Africa: Double digit top-line growth with continued market share gain
Operating performance:
2Q23: Revenue grew by high-teens, with revenue per hl growth of more than 10%, driven by pricing actions and other revenue management initiatives. Our volumes grew by high-single digits, ahead of the industry according to our estimates, driven by strong consumer demand for our brands and supported by a favorable comparable due to production constraints in 2Q22. EBITDA was flattish as top-line growth was offset primarily by anticipated commodity cost headwinds.
HY23: Revenue grew by low-teens with high-single digit revenue per hl growth and a mid-single digit increase in volume. EBITDA declined by low-single digits.
Commercial highlights: We continue to see strong consumer demand for our portfolio, gaining share of beer and total alcohol according to our estimates. Carling Black Label, the #1 beer brand in the country, led our performance this quarter with high-teens volume growth and our global brands grew volumes by more than 50%, driven by Corona.
China: Double-digit top- and bottom-line growth
Operating performance:
2Q23: Volumes grew by 11.0%, outperforming the industry according to our estimates. Revenue per hl increased by 7.6%, driven by on-premise recovery and continued premiumization, resulting in revenue growth of 19.4%. EBITDA grew by 21.8%.
HY23: Volumes grew by 9.4% and revenue per hl by 5.4%, leading to a total revenue increase of 15.3%. EBITDA grew by 17.4%.
Commercial highlights: We delivered volume growth across all segments of our portfolio this quarter, led by mid-twenties volume growth in both our premium and super premium portfolios. The roll out and adoption of the BEES platform continued, with BEES now present in over 220 cities and over 45% of our revenue through digital channels in June.
Highlights from our other markets
Canada: Revenue increased by low-single digits this quarter with revenue per hl growth of high-single digits, driven by revenue management initiatives and premiumization. Volumes declined by mid-single digits, underperforming a soft industry.
Peru: Revenue grew by high-single digits this quarter with revenue per hl growing by low-teens, driven primarily by revenue management initiatives. Volumes declined by low-single digits, outperforming a soft industry and gaining share of total alcohol.
Ecuador: Revenue grew by high-single digits in 2Q23 with volumes increasing by low-single digits, supported by continued share of total alcohol gains. Our above core brands continued to lead our growth, delivering a double-digit revenue increase.
Argentina: Revenue increased by high-single digits on a reported USD basis and by over 100% on an organic basis in 2Q23, driven by revenue management initiatives in a highly inflationary environment. Beer volumes grew by low-single digits with total volumes declining by low-single digits.
Africa excluding South Africa: In Nigeria, our top-line grew by mid-teens this quarter with total volumes declining by high-single digits, driven by a soft industry which was impacted by the continued challenging operating environment. In our other markets, we grew volumes in aggregate by high-single digits in 2Q23, driven primarily by Tanzania, Ghana and Uganda.
South Korea: Total revenue declined by high-single digits, driven by a low-single digit volume decline as we cycled post-COVID recovery in 2Q22. Revenue per hl decreased by mid-single digits, driven primarily by an excise tax increase.
Consolidated Income Statement
Figure 3. Consolidated income statement (million USD)
2Q222Q23Organic
growth
Revenue14 79315 1207.2%
Cost of sales-6 796-7 019-9.2%
Gross profit7 9978 1015.5%
SG&A-4 500-4 707-9.4%
Other operating income/(expenses)31417547.8%
Normalized profit from operations (normalized EBIT)3 8113 5692.2%
Non-underlying items above EBIT (incl. impairment losses)-9-60
Net finance income/(cost)-1 252-1 283
Non-underlying net finance income/(cost)72-1 078
Share of results of associates7455
Income tax expense-721-595
Profit1 975607
Profit attributable to non-controlling interest378269
Profit attributable to equity holders of AB InBev1 597339
Normalized EBITDA5 0964 9095.0%
Underlying profit attributable to equity holders of AB InBev1 4681 452
HY22HY23Organic
growth
Revenue28 02729 33310.0%
Cost of sales-12 784-13 536-11.5%
Gross profit15 24315 7968.8%
SG&A-8 616-9 051-9.8%
Other operating income/(expenses)47832726.2%
Normalized profit from operations (normalized EBIT)7 1057 0728.3%
Non-underlying items above EBIT (incl. impairment losses)-105-107
Net finance income/(cost)-2 444-2 520
Non-underlying net finance income/(cost)176-703
Share of results of associates129105
Non-underlying share of results of associates-1 143-
Income tax expense-1 244-1 192
Profit2 4742 655
Profit attributable to non-controlling interest782678
Profit attributable to equity holders of AB InBev1 6921 977
Normalized EBITDA9 5839 6689.1%
Underlying profit attributable to equity holders of AB InBev2 6722 762
We are reporting our Argentinean operation applying hyperinflation accounting under IAS 29, following the categorization of Argentina as a country with a three-year cumulative inflation rate greater than 100%, since 2018. Inflation in Argentina has accelerated over the past 12 months, resulting in a more significant impact on the organic revenue growth of AB InBev than historically. For illustrative purposes, fully excluding the Argentinean operation, 2Q23 organic revenue increased for AB InBev would be 4.6% versus the 7.2% reported. For HY23 revenue growth for AB InBev would be 6.7% versus the 10.0% reported.
Consolidated other operating income/(expenses) in 2Q23 increased by 26.2% primarily driven by higher government grants and the impact of disposal of non-core assets year-over-year. In HY22, Ambev recognized 201 million USD income in other operating income related to tax credits. The year-over-year change is presented as a scope change and does not affect the presented organic growth rates.
Non-underlying items above EBIT & Non-underlying share of results of associates
Figure 4. Non-underlying items above EBIT & Non-underlying share of results of associates (million USD)
2Q222Q23HY22HY23
COVID-19 costs-4--13-
Restructuring-14-22-51-50
Business and asset disposal (incl. impairment losses)10-196-38
Legal costs--19--19
AB InBev Efes related costs-1--47-
Non-underlying items in EBIT-9-60-105-107
Non-underlying share of results of associates---1 143-
EBIT excludes negative non-underlying items of 60 million USD in 2Q23 and 107 million USD in HY23.
Non-underlying share of results of associates of HY22 includes the non-cash impairment of 1 143 million USD the company recorded on its investment in AB InBev Efes in 1Q22.
Net finance income/(cost)
Figure 5. Net finance income/(cost) (million USD)
2Q222Q23HY22HY23
Net interest expense-838-824-1 683-1 630
Net interest on net defined benefit liabilities-19-21-37-42
Accretion expense-185-202-336-385
Net interest income on Brazilian tax credits654711378
Other financial results-275-283-501-540
Net finance income/(cost)-1 252-1 283-2 444-2 520
Non-underlying net finance income/(cost)
Figure 6. Non-underlying net finance income/(cost) (million USD)
2Q222Q23HY22HY23
Mark-to-market65-1 078296-703
Gain/(loss) on bond redemption and other7--120-
Non-underlying net finance income/(cost)72-1 078176-703
Non-underlying net finance cost in HY23 includes mark-to-market losses on derivative instruments entered into to hedge our shared-based payment programs and shares issued in relation to the combination with Grupo Modelo and SAB.
The number of shares covered by the hedging of our share-based payment program, the deferred share instrument and the restricted shares are shown in figure 7, together with the opening and closing share prices.
Figure 7. Non-underlying equity derivative instruments
2Q222Q23HY22HY23
Share price at the start of the period (Euro)54.2661.3353.1756.27
Share price at the end of the period (Euro)51.3651.8351.3651.83
Number of equity derivative instruments at the end of the period (millions)100.5100.5100.5100.5
Income tax expense
Figure 8. Income tax expense (million USD)
2Q222Q23HY22HY23
Income tax expense7215951 2441 192
Effective tax rate27.5%51.9%26.3%31.9%
Normalized effective tax rate30.3%27.8%28.2%27.3%
The decrease in normalized ETR in 2Q23 compared to 2Q22 and the decrease in HY23 compared to HY22 is driven by country mix.
Figure 9. Underlying Profit attributable to equity holders of AB InBev (million USD)
2Q222Q23HY22HY23
Profit attributable to equity holders of AB InBev1 5973391 6921 977
Net impact of non-underlying items on profit- 1141 0911 006750
Hyperinflation impacts in underlying profit- 1522- 2635
Underlying profit attributable to equity holders of AB InBev1 4681 4522 6722 762
Underlying profit attributable to equity holders in 2Q22 and HY22 were positively impacted by 115 million USD and 152 million USD respectively, and in 2Q23 and HY23 by 29 million USD and 48 million USD respectively, after tax and non-controlling interest related to tax credits in Brazil.
Basic and underlying EPS
Figure 10. Earnings per share (USD)
2Q222Q23HY22HY23
Basic EPS0.790.170.840.98
Net impact of non-underlying items on profit-0.070.540.500.37
Hyperinflation impacts in EPS-0.010.01-0.010.02
Underlying EPS0.730.721.331.37
Weighted average number of ordinary and restricted shares (million)2 0122 0162 0122 016
Figure 11. Key components - Underlying EPS in USD
2Q222Q23HY22HY23
Normalized EBIT before hyperinflation1.901.783.553.54
Hyperinflation impacts in normalized EBIT-0.01-0.01-0.02-0.03
Normalized EBIT1.901.773.533.51
Net finance cost-0.62-0.64-1.21-1.25
Income tax expense-0.39-0.31-0.65-0.62
Associates & non-controlling interest-0.15-0.11-0.32-0.29
Hyperinflation impacts in EPS-0.010.01-0.010.02
Underlying EPS0.730.721.331.37
Weighted average number of ordinary and restricted shares (million)2 0122 0162 0122 016
Reconciliation between normalized EBITDA and profit attributable to equity holders
Figure 12. Reconciliation of normalized EBITDA to profit attributable to equity holders of AB InBev (million USD)
2Q222Q23HY22HY23
Profit attributable to equity holders of AB InBev1 5973391 6921 977
Non-controlling interests378269782678
Profit1 9756072 4742 655
Income tax expense7215951 2441 192
Share of result of associates-74-55-129-105
Non-underlying share of results of associates--1 143-
Net finance (income)/cost1 2521 2832 4442 520
Non-underlying net finance (income)/cost-721 078-176703
Non-underlying items above EBIT (incl. impairment losses)960105107
Normalized EBIT3 8113 5697 1057 072
Depreciation, amortization and impairment1 2861 3402 4772 596
Normalized EBITDA5 0964 9099 5839 668
Normalized EBITDA and normalized EBIT are measures utilized by AB InBev to demonstrate the company’s underlying performance.
Normalized EBITDA is calculated excluding the following effects from profit attributable to equity holders of AB InBev: (i) non-controlling interest; (ii) income tax expense; (iii) share of results of associates; (iv) non-underlying share of results of associates; (v) net finance income or cost; (vi) non-underlying net finance income or cost; (vii) non-underlying items above EBIT; and (viii) depreciation, amortization and impairment.
Normalized EBITDA and normalized EBIT are not accounting measures under IFRS accounting and should not be considered as an alternative to profit attributable to equity holders as a measure of operational performance, or an alternative to cash flow as a measure of liquidity. Normalized EBITDA and normalized EBIT do not have a standard calculation method and AB InBev’s definition of normalized EBITDA and normalized EBIT may not be comparable to that of other companies.
Financial position
Figure 13. Cash Flow Statement (million USD)
HY22HY23
Operating activities
Profit of the period2 4742 655
Interest, taxes and non-cash items included in profit7 0157 512
Cash flow from operating activities before changes in working capital and use of provisions9 48910 167
Change in working capital-3 339-4 615
Pension contributions and use of provisions-195-192
Interest and taxes (paid)/received-3 823-3 806
Dividends received5043
Cash flow from operating activities2 1821 597
Investing activities
Net capex-1 939-2 063
Sale/(acquisition) of subsidiaries, net of cash disposed/ acquired of-44-8
Net proceeds from sale/(acquisition) of other assets6610
Cash flow from / (used in) investing activities-1 917-2 061
Financing activities
Dividends paid-1 276-1 923
Net (payments on)/proceeds from borrowings-3 452155
Payment of lease liabilities-286-359
Sale/(purchase) of non-controlling interests and other-378-696
Cash flow from / (used in) financing activities-5 392-2 823
.
Net increase/(decrease) in cash and cash equivalents-5 128-3 287
HY23 recorded a decrease in cash and cash equivalents of 3 287 million USD compared to a decrease of 5 128 million USD in HY22, with the following movements:
Our cash flow from operating activities reached 1 597 million USD in HY23 compared to 2 182 million USD in HY22. The decrease was driven by changes in working capital for HY23 compared to HY22. Changes in working capital in the first half of 2023 and 2022 reflect higher working capital levels at the end of June than at year-end as a result of seasonality.
Our cash outflow from investing activities was 2 061 million USD in HY23 compared to a cash outflow of 1 917 million USD in HY22. The increase in the cash outflow from investing activities was mainly due to higher net capital expenditures in HY23 compared to HY22. Out of the total HY23 capital expenditures, approximately 33% was used to improve the company’s production facilities while 49% was used for logistics and commercial investments and 18% was used for improving administrative capabilities and for the purchase of hardware and software.
Our cash outflow from financing activities amounted to 2 823 million USD in HY23, as compared to a cash outflow of 5 392 million USD in HY22. The decrease is primarily driven by lower debt redemption in HY23 compared to HY22.
Our net debt increased to 73.8 billion USD as of 30 June 2023 from 69.7 billion USD as of 31 December 2022.
Our net debt to normalized EBITDA ratio was 3.70x as of 30 June 2023. Our optimal capital structure is a net debt to normalized EBITDA ratio of around 2x.
We continue to proactively manage our debt portfolio. 96% of our bond portfolio holds a fixed-interest rate, 42% is denominated in currencies other than USD and maturities are well-distributed across the next several years.
As of 30 June 2023, we had total liquidity of 16.9 billion USD, which consisted of 10.1 billion USD available under committed long-term credit facilities and 6.8 billion USD of cash, cash equivalents and short-term investments in debt securities less bank overdrafts.
Notes
To facilitate the understanding of AB InBev’s underlying performance, the analyses of growth, including all comments in this press release, unless otherwise indicated, are based on organic growth and normalized numbers. In other words, financials are analyzed eliminating the impact of changes in currencies on translation of foreign operations, and scope changes. Scope changes represent the impact of acquisitions and divestitures, the start or termination of activities or the transfer of activities between segments, curtailment gains and losses and year over year changes in accounting estimates and other assumptions that management does not consider as part of the underlying performance of the business. The organic growth of our global brands, Budweiser, Stella Artois and Corona, excludes exports to Australia for which a perpetual license was granted to a third party upon disposal of the Australia operations in 2020. All references per hectoliter (per hl) exclude US non-beer activities. Whenever presented in this document, all performance measures (EBITDA, EBIT, profit, tax rate, EPS) are presented on a “normalized” basis, which means they are presented before non-underlying items. Non-underlying items are either income or expenses which do not occur regularly as part of the normal activities of the Company. They are presented separately because they are important for the understanding of the underlying sustainable performance of the Company due to their size or nature. Normalized measures are additional measures used by management and should not replace the measures determined in accordance with IFRS as an indicator of the Company’s performance. As from 1 January 2023, mark-to-market gains/(losses) on derivatives related to the hedging of our share-based payment programs are reported in the non-underlying net finance income/(cost). The 2022 presentation was amended to conform to the 2023 presentation. We are reporting the results from Argentina applying hyperinflation accounting since 3Q18. The IFRS rules (IAS 29) require us to restate the year-to-date results for the change in the general purchasing power of the local currency, using official indices before converting the local amounts at the closing rate of the period. These impacts are excluded from organic calculations. In HY23, we reported a negative impact on the profit attributable to equity holders of AB InBev of 35 million USD. The impact in HY23 underlying EPS was -0.02 USD. Values in the figures and annexes may not add up, due to rounding. 2Q23 and HY23 EPS is based upon a weighted average of 2 016 million shares compared to a weighted average of 2 012 million shares for 2Q22 and HY22.
Legal disclaimer
This release contains “forward-looking statements”. These statements are based on the current expectations and views of future events and developments of the management of AB InBev and are naturally subject to uncertainty and changes in circumstances. The forward-looking statements contained in this release include statements other than historical facts and include statements typically containing words such as “will”, “may”, “should”, “believe”, “intends”, “expects”, “anticipates”, “targets”, “estimates”, “likely”, “foresees” and words of similar import. All statements other than statements of historical facts are forward-looking statements. You should not place undue reliance on these forward-looking statements, which reflect the current views of the management of AB InBev, are subject to numerous risks and uncertainties about AB InBev and are dependent on many factors, some of which are outside of AB InBev’s control. There are important factors, risks and uncertainties that could cause actual outcomes and results to be materially different, including, but not limited to the risks and uncertainties relating to AB InBev that are described under Item 3.D of AB InBev’s Annual Report on Form 20-F filed with the SEC on 17 March 2023. Many of these risks and uncertainties are, and will be, exacerbated by any further worsening of the global business and economic environment, the ongoing conflict in Russia and Ukraine and the COVID-19 pandemic. Other unknown or unpredictable factors could cause actual results to differ materially from those in the forward-looking statements. The forward-looking statements should be read in conjunction with the other cautionary statements that are included elsewhere, including AB InBev’s most recent Form 20-F and other reports furnished on Form 6-K, and any other documents that AB InBev has made public. Any forward-looking statements made in this communication are qualified in their entirety by these cautionary statements and there can be no assurance that the actual results or developments anticipated by AB InBev will be realized or, even if substantially realized, that they will have the expected consequences to, or effects on, AB InBev or its business or operations. Except as required by law, AB InBev undertakes no obligation to publicly update or revise any forward-looking statements, whether as a result of new information, future events or otherwise. The second quarter 2023 (2Q23) and half year 2023 (HY23) financial data set out in Figure 1 (except for the volume information), Figures 3 to 5, 6, 8, 9, 12 and 13 of this press release have been extracted from the group’s unaudited condensed consolidated interim financial statements as of and for the six months ended 30 June 2023, which have been reviewed by our statutory auditors PwC Réviseurs d’Entreprises SRL / PwC Bedrijfsrevisoren BV in accordance with the standards of the Public Company Accounting Oversight Board (United States). Financial data included in Figures 7, 10, 11 and 14 have been extracted from the underlying accounting records as of and for the six months ended 30 June 2023 (except for the volume information). References in this document to materials on our websites, such as www.bees.com, are included as an aid to their location and are not incorporated by reference into this document.
Conference call and webcast
Investor Conference call and webcast on Thursday, 3 August 2023:
3.00pm Brussels / 2.00pm London / 9.00am New York
Registration details:
Webcast (listen-only mode):
AB InBev 2Q23 Results Webcast
To join by phone, please use one of the following two phone numbers:
Toll-Free: 877-407-8029
Toll: 201-689-8029
About Anheuser-Busch InBev (AB InBev)
Anheuser-Busch InBev (AB InBev) is a publicly traded company (Euronext: ABI) based in Leuven, Belgium, with secondary listings on the Mexico (MEXBOL: ANB) and South Africa (JSE: ANH) stock exchanges and with American Depositary Receipts on the New York Stock Exchange (NYSE: BUD). As a company, we dream big to create a future with more cheers. We are always looking to serve up new ways to meet life’s moments, move our industry forward and make a meaningful impact in the world. We are committed to building great brands that stand the test of time and to brewing the best beers using the finest ingredients. Our diverse portfolio of well over 500 beer brands includes global brands Budweiser®, Corona® and Stella Artois®; multi-country brands Beck’s®, Hoegaarden®, Leffe® and Michelob ULTRA®; and local champions such as Aguila®, Antarctica®, Bud Light®, Brahma®, Cass®, Castle®, Castle Lite®, Cristal®, Harbin®, Jupiler®, Modelo Especial®, Quilmes®, Victoria®, Sedrin®, and Skol®. Our brewing heritage dates back more than 600 years, spanning continents and generations. From our European roots at the Den Hoorn brewery in Leuven, Belgium. To the pioneering spirit of the Anheuser & Co brewery in St. Louis, US. To the creation of the Castle Brewery in South Africa during the Johannesburg gold rush. To Bohemia, the first brewery in Brazil. Geographically diversified with a balanced exposure to developed and developing markets, we leverage the collective strengths of approximately 167,000 colleagues based in nearly 50 countries worldwide. For 2022, AB InBev’s reported revenue was 57.8 billion USD (excluding JVs and associates).
Annex 1: Segment reporting (2Q)
AB InBev Worldwide2Q22ScopeCurrency
TranslationHyperinflation
restatementOrganic
Growth2Q23Organic
Growth
Total volumes (thousand hls)149 729----2 147147 583-1.4%
of which AB InBev own beer131 10719---2 376128 750-1.8%
Revenue14 793-20-8701531 06515 1207.2%
Cost of sales-6 79612430-41- 625-7 019-9.2%
Gross profit7 997-8-4401114408 1015.5%
SG&A-4 500-11264-38-421-4 707-9.4%
Other operating income/(expenses)314-186-1516117547.8%
Normalized EBIT3 811-205-19175803 5692.2%
Normalized EBITDA5 096-205-263382434 9095.0%
Normalized EBITDA margin34.5% 32.5%-69 bps
North America2Q22ScopeCurrency
TranslationHyperinflation
restatementOrganic
Growth2Q23Organic
Growth
Total volumes (thousand hls)27 36135---3 85423 542-14.1%
Revenue4 390--42--3953 953-9.0%
Cost of sales-1 785-115-27-1 7451.5%
Gross profit2 604-1-28--3672 208-14.1%
SG&A-1 209-214--18-1 215-1.5%
Other operating income/(expenses)7---31036.0%
Normalized EBIT1 402-3-14--3831 003-27.4%
Normalized EBITDA1 597-3-16--3891 189-24.4%
Normalized EBITDA margin36.4% 30.1%-616 bps
Middle Americas2Q22ScopeCurrency
TranslationHyperinflation
restatementOrganic
Growth2Q23Organic
Growth
Total volumes (thousand hls)37 775---11837 8930.3%
Revenue3 594-122-3684 08410.2%
Cost of sales-1 4351-39--98-1 571-6.8%
Gross profit2 159183-2702 51312.5%
SG&A-874-8-35--68-985-7.7%
Other operating income/(expenses)-14---2310-
Normalized EBIT1 271-648-2251 53817.8%
Normalized EBITDA1 610-665-2471 91615.4%
Normalized EBITDA margin44.8% 46.9%210 bps
South America2Q22ScopeCurrency
TranslationHyperinflation
restatementOrganic
Growth2Q23Organic
Growth
Total volumes (thousand hls)36 4217--- 69135 737-1.9%
Revenue2 626--6511536152 74223.8%
Cost of sales-1 419-295-41-258-1 423-18.4%
Gross profit1 207--3561113571 31930.2%
SG&A-855-6205-38-232-926-27.3%
Other operating income/(expenses)243-184-141358159.3%
Normalized EBIT595-190-1657516047541.0%
Normalized EBITDA820-190-2213829073747.2%
Normalized EBITDA margin31.2% 26.9%440 bps
EMEA2Q22ScopeCurrency
TranslationHyperinflation
restatementOrganic
Growth2Q23Organic
Growth
Total volumes (thousand hls)22 83860---1422 884-0.1%
Revenue2 14022-173-2592 24812.0%
Cost of sales-1 087-12100--208-1 207-18.9%
Gross profit1 05410-74-511 0414.8%
SG&A-680-1744--9-662-1.2%
Other operating income/(expenses)49-3-1-1472.5%
Normalized EBIT423-9-31-4342610.4%
Normalized EBITDA692-9-52-496807.2%
Normalized EBITDA margin32.3% 30.3%-134 bps
Asia Pacific2Q22ScopeCurrency
TranslationHyperinflation
restatementOrganic
Growth2Q23Organic
Growth
Total volumes (thousand hls)25 097---2 37827 4759.5%
Revenue1 835-2-125-2661 97314.5%
Cost of sales-881-58--105-927-11.9%
Gross profit954-2-67 1611 04617.0%
SG&A-531137--90-584-17.1%
Other operating income/(expenses)26--1--521-17.3%
Normalized EBIT449-1-31-6648314.8%
Normalized EBITDA620-1-41-6664510.7%
Normalized EBITDA margin33.8% 32.7%-113 bps
Global Export and Holding Companies2Q22ScopeCurrency
TranslationHyperinflation
restatementOrganic
Growth2Q23Organic
Growth
Total volumes (thousand hls)238-102---8451-62.3%
Revenue208-41---48119-28.8%
Cost of sales-189242-17-14710.3%
Gross profit19-172--31-27-
SG&A-35021-2--4-336-1.3%
Other operating income/(expenses)2-1-37-
Normalized EBIT-33041--32-357-9.8%
Normalized EBITDA-24242--21-257-8.6%
Annex 2: Segment reporting (HY)
AB InBev WorldwideHY22ScopeCurrency
TranslationOrganic
GrowthHY23Organic
Growth
Total volumes (thousand hls)289 074--- 943288 131-0.3%
of which AB InBev own beer251 69229--1 911249 810-0.8%
Revenue28 027-39-1 4592 80429 33310.0%
Cost of sales-12 78421690-1 463-13 536-11.5%
Gross profit15 243-18-7691 34015 7968.8%
SG&A-8 616-16426-845-9 051-9.8%
Other operating income/(expenses)478-204-197232726.2%
Normalized EBIT7 105-239-3625677 0728.3%
Normalized EBITDA9 583-239-5248489 6689.1%
Normalized EBITDA margin34.2% 33.0%-29 bps
North AmericaHY22ScopeCurrency
TranslationOrganic
GrowthHY23Organic
Growth
Total volumes (thousand hls)51 44851--4 10447 395-8.0%
Revenue8 1922-67-2017 926-2.5%
Cost of sales-3 349-223-92-3 420-2.7%
Gross profit4 844--44-2934 506-6.0%
SG&A-2 279-2825-71-2 354-3.1%
Other operating income/(expenses)28---1018-35.6%
Normalized EBIT2 592-29-19-3742 171-14.6%
Normalized EBITDA2 975-29-23-3852 539-13.1%
Normalized EBITDA margin36.3% 32.0%-391 bps
Middle AmericasHY22ScopeCurrency
TranslationOrganic
GrowthHY23Organic
Growth
Total volumes (thousand hls)72 024--14172 1640.2%
Revenue6 693-1737077 57310.6%
Cost of sales-2 6251-58-245-2 926-9.3%
Gross profit4 06821144634 64611.4%
SG&A-1 631-12-53-167-1 863-10.1%
Other operating income/(expenses)-12--198-
Normalized EBIT2 425-10623152 79213.0%
Normalized EBITDA3 060-10893553 49411.6%
Normalized EBITDA margin45.7% 46.1%44 bps
South AmericaHY22ScopeCurrency
TranslationOrganic
GrowthHY23Organic
Growth
Total volumes (thousand hls)76 815--- 79176 023-1.0%
Revenue5 333--9641 4805 84928.0%
Cost of sales-2 792-405-562-2 949-20.2%
Gross profit2 541--5589182 90036.5%
SG&A-1 609-13280-462-1 804-28.7%
Other operating income/(expenses)312-201-137317166.0%
Normalized EBIT1 244-213-2925291 26852.2%
Normalized EBITDA1 666-213-4097231 76650.3%
Normalized EBITDA margin31.2% 30.2%469 bps
EMEAHY22ScopeCurrency
TranslationOrganic
GrowthHY23Organic
Growth
Total volumes (thousand hls)42 962104-- 22442 842-0.5%
Revenue3 94038-3364294 07010.8%
Cost of sales-2 000-20191-381-2 210-18.9%
Gross profit1 93918-145481 8602.5%
SG&A-1 341-3194-29-1 307-2.1%
Other operating income/(expenses)88-4-32831.9%
Normalized EBIT685-16-55216353.1%
Normalized EBITDA1 192-15-97631 1425.3%
Normalized EBITDA margin30.3% 28.1%-146 bps
Asia PacificHY22ScopeCurrency
TranslationOrganic
GrowthHY23Organic
Growth
Total volumes (thousand hls)45 385--4 20449 5899.3%
Revenue3 471-6-2624763 67913.7%
Cost of sales-1 655-125-219-1 750-13.2%
Gross profit1 816-7-1372571 92914.2%
SG&A- 999473-110-1 033-11.1%
Other operating income/(expenses)67--4-1053-15.5%
Normalized EBIT884-3-6813694915.5%
Normalized EBITDA1 232-3-911361 27311.0%
Normalized EBITDA margin35.5% 34.6%-84 bps
Global Export and Holding CompaniesHY22ScopeCurrency
TranslationOrganic
GrowthHY23Organic
Growth
Total volumes (thousand hls)440-155--168117-58.9%
Revenue399-73-3-87236-26.6%
Cost of sales-36242435-28110.9%
Gross profit36-311-52-45-
SG&A-756647-6-692-0.9%
Other operating income/(expenses)-5-1-2-6-
Normalized EBIT-7253310-60-742-8.6%
Normalized EBITDA-541327-43-545-8.5%
Annex 3: Consolidated statement of financial position
Million US dollar30 June 202331 December 2022
.
ASSETS
Non-current assets
Property, plant and equipment27 18126 671
Goodwill116 168113 010
Intangible assets40 97340 209
Investments in associates4 7284 656
Investment securities179175
Deferred tax assets2 8362 300
Employee benefits1111
Income tax receivables835883
Derivatives6260
Trade and other receivables1 8951 782
Total non-current assets194 868189 757
Current assets
Investment securities8597
Inventories6 8396 612
Income tax receivables912813
Derivatives157331
Trade and other receivables6 6095 330
Cash and cash equivalents6 8489 973
Assets classified as held for sale3530
Total current assets21 48323 186
Total assets216 352212 943
EQUITY AND LIABILITIES
Equity
Issued capital1 7361 736
Share premium17 62017 620
Reserves18 83515 218
Retained earnings39 26938 823
Equity attributable to equity holders of AB InBev77 46073 398
Non-controlling interests11 32410 880
Total equity88 78384 278
Non-current liabilities
Interest-bearing loans and borrowings78 32378 880
Employee benefits1 5211 534
Deferred tax liabilities12 00311 818
Income tax payables595610
Derivatives113184
Trade and other payables872859
Provisions370396
Total non-current liabilities93 79694 282
Current liabilities
Bank overdrafts5383
Interest-bearing loans and borrowings2 5241 029
Income tax payables1 2631 438
Derivatives6 3405 308
Trade and other payables23 34726 349
Provisions244176
Total current liabilities33 77334 383
Total equity and liabilities216 352212 943
Annex 4: Consolidated statement of cash flows
For the six-month period ended 30 June
Million US dollar20232022
.
OPERATING ACTIVITIES
Profit of the period2 6552 474
Depreciation, amortization and impairment2 5952 477
Net finance cost/(income)3 2232 268
Equity-settled share-based payment expense286237
Income tax expense1 1921 244
Other non-cash items321-225
Share of result of associates-1051 014
Cash flow from operating activities before changes in working capital and use of provisions10 1679 489
Decrease/(increase) in trade and other receivables-1 325-581
Decrease/(increase) in inventories-228-833
Increase/(decrease) in trade and other payables-3 062-1 925
Pension contributions and use of provisions-192-195
Cash generated from operations5 3605 955
Interest paid-2 322-2 082
Interest received512177
Dividends received4350
Income tax paid-1 996-1 918
Cash flow from operating activities1 5972 182
.
INVESTING ACTIVITIES
Acquisition of property, plant and equipment and of intangible assets-2 107-2 002
Proceeds from sale of property, plant and equipment and of intangible assets4463
Sale/(acquisition) of subsidiaries, net of cash disposed/ acquired of-8-44
Proceeds from sale/(acquisition) of other assets1066
Cash flow from/(used in) investing activities-2 061-1 917
.
FINANCING ACTIVITIES
Sale/(purchase) of non-controlling interests-3-52
Proceeds from borrowings18168
Payments on borrowings-26-3 520
Cash net finance (cost)/income other than interests-693-326
Payment of lease liabilities-359-286
Dividends paid-1 923-1 276
Cash flow from/(used in) financing activities-2 823-5 392
.
Net increase/(decrease) in cash and cash equivalents-3 287-5 128
Cash and cash equivalents less bank overdrafts at beginning of year9 89012 043
Effect of exchange rate fluctuations191-18
Cash and cash equivalents less bank overdrafts at end of period6 7946 897
Contacts
Investors
Shaun Fullalove
Tel: +1 212 573 9287
E-mail: shaun.fullalove@ab-inbev.com
Maria Glukhova
Tel: +32 16 276 888
E-mail: maria.glukhova@ab-inbev.com
Cyrus Nentin
Tel: +1 646 746 9673
E-mail: cyrus.nentin@ab-inbev.com
Media
Fallon Buckelew
Tel: +1 310 592 6319
E-mail: fallon.buckelew@ab-inbev.com
Michaël Cloots
Tel: +32 497 167 183
E-mail: michael.cloots@ab-inbev.com
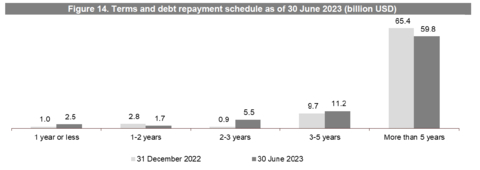
Figure 14. Terms and debt repayment schedule as of 30 June 2023 (billion USD) (Graphic: Business Wire)
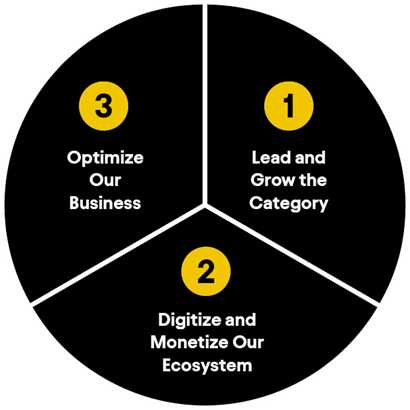
ABI Strategic Priorities (Graphic: Business Wire)
本文链接:http://www.iruis.com/News/cninfo/66577.shtml


热门资讯

起亚中国高管称等本土企业烧死再抢市场
点击:123
网龙网络:董事长郑辉突发疾病逝世
点击:123
极狐汽车法务部开通微博,首条博文怒怼百万粉丝车…
点击:119

销量品牌力均不足,极星汽车急寻救星
点击:118
长安欧尚Z6新能源半年降价3万多,车主集体投诉
点击:115

先锋启势 再创传奇 DiaStar Original钻星创始型系…
点击:113

七夕浪漫集结,高颜值腕表CP谁能不磕?
点击:111

浪潮信息该如何摆脱海外供应限制?
点击:110
微软已经将Yammer改名为Viva Engage
点击:108

姚劲波放狠话,“神奇的”58同城需直面困境
点击:107